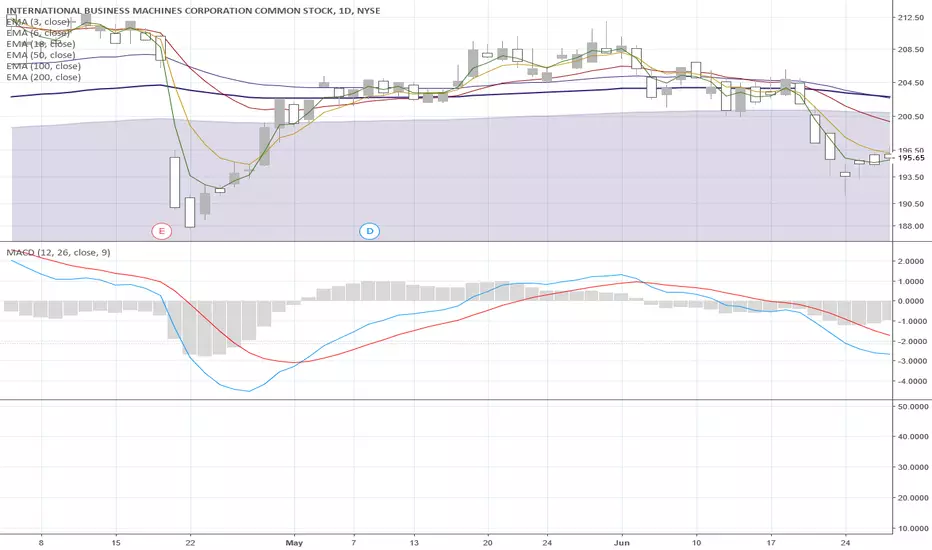
In the candlestick chart at the top you'll see daily interval prices of IBM corporation with a layover of the 12 and 26 period exponential moving averages. In the lower portion of the chart you'll see the MACD indicator, the slower 'trigger line' or 9 period Simple moving average, and the zero line around which the first two oscillate.
The typical default parameters for the MACD are most commonly 12/26/9, meaning the MACD plots the difference between the 12 and 26 (12-26) Exponential moving averages. The 9 parameter represents the 9-period Simple moving average of the MACD calculation.
The typical default parameters for the MACD are most commonly 12/26/9, meaning the MACD plots the difference between the 12 and 26 (12-26) Exponential moving averages. The 9 parameter represents the 9-period Simple moving average of the MACD calculation.
คำจำกัดสิทธิ์ความรับผิดชอบ
ข้อมูลและบทความไม่ได้มีวัตถุประสงค์เพื่อก่อให้เกิดกิจกรรมทางการเงิน, การลงทุน, การซื้อขาย, ข้อเสนอแนะ หรือคำแนะนำประเภทอื่น ๆ ที่ให้หรือรับรองโดย TradingView อ่านเพิ่มเติมใน ข้อกำหนดการใช้งาน
คำจำกัดสิทธิ์ความรับผิดชอบ
ข้อมูลและบทความไม่ได้มีวัตถุประสงค์เพื่อก่อให้เกิดกิจกรรมทางการเงิน, การลงทุน, การซื้อขาย, ข้อเสนอแนะ หรือคำแนะนำประเภทอื่น ๆ ที่ให้หรือรับรองโดย TradingView อ่านเพิ่มเติมใน ข้อกำหนดการใช้งาน