This will be predictive graph theory idea given my last post remains valid. Will link it below.
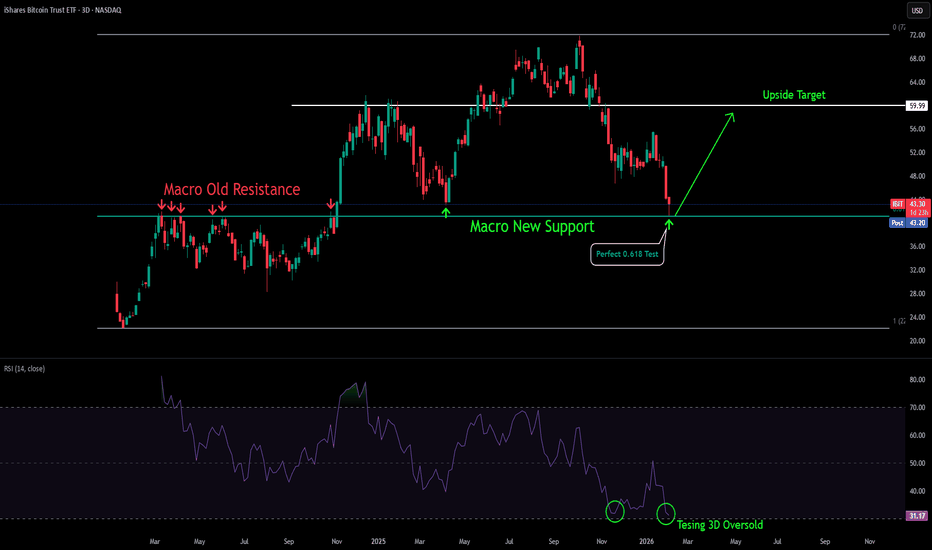
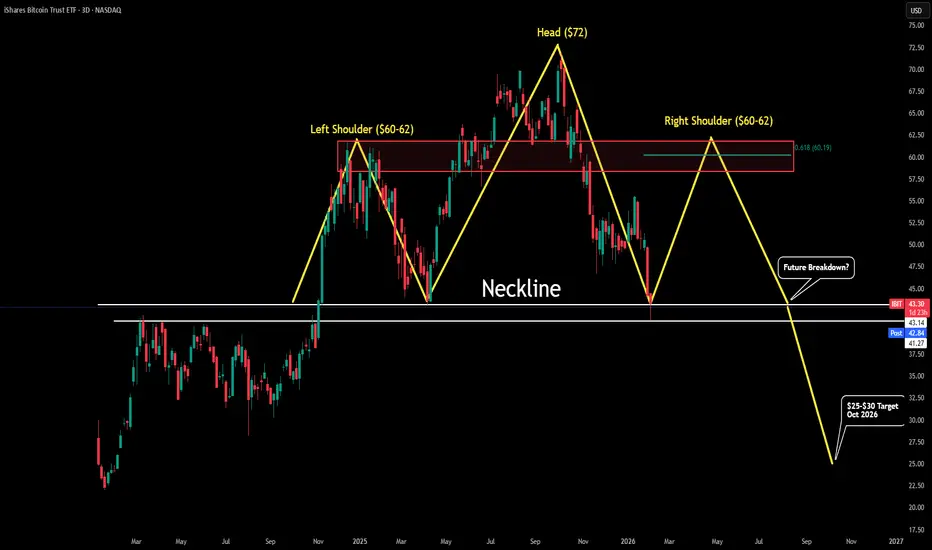
If buyers continue to hold this $40-42 level as macro support then we expect IBIT to rally as much as 50% towards a $60-62 target!
If/When IBIT is able to complete this move, then we can predict sellers will use this level in the future to create a "right shoulder" in this seeming-to-develop Head & Shoulders pattern. This would correspond perfectly to the 0.618 of the micro trend and also our red box of potential "supply" for sellers.
If/When sellers create a a right shoulder then we should expect price to drop back towards the neckline ($40-$42). Its hard to say exactly where the neckline sits but it should be one of the two white lines I have drawn.
If/When IBIT breaks this "neckline" then we should expect price to head towards the $25-30 level. The very low was $22 but a sweet spot seems to be around $28. It all depends on how low BTC drops, but given BTC continues to respect its 4yr cycle theory we should also expect IBIT to behave in a similar way.
Therefore, the bottom for IBIT will most likely occur around October 2026.
Keep in mind this is a highly speculative post, but one I will be adding confirmations to as they happen.
คำจำกัดสิทธิ์ความรับผิดชอบ
ข้อมูลและบทความไม่ได้มีวัตถุประสงค์เพื่อก่อให้เกิดกิจกรรมทางการเงิน, การลงทุน, การซื้อขาย, ข้อเสนอแนะ หรือคำแนะนำประเภทอื่น ๆ ที่ให้หรือรับรองโดย TradingView อ่านเพิ่มเติมใน ข้อกำหนดการใช้งาน
คำจำกัดสิทธิ์ความรับผิดชอบ
ข้อมูลและบทความไม่ได้มีวัตถุประสงค์เพื่อก่อให้เกิดกิจกรรมทางการเงิน, การลงทุน, การซื้อขาย, ข้อเสนอแนะ หรือคำแนะนำประเภทอื่น ๆ ที่ให้หรือรับรองโดย TradingView อ่านเพิ่มเติมใน ข้อกำหนดการใช้งาน