📊Technical Analysis
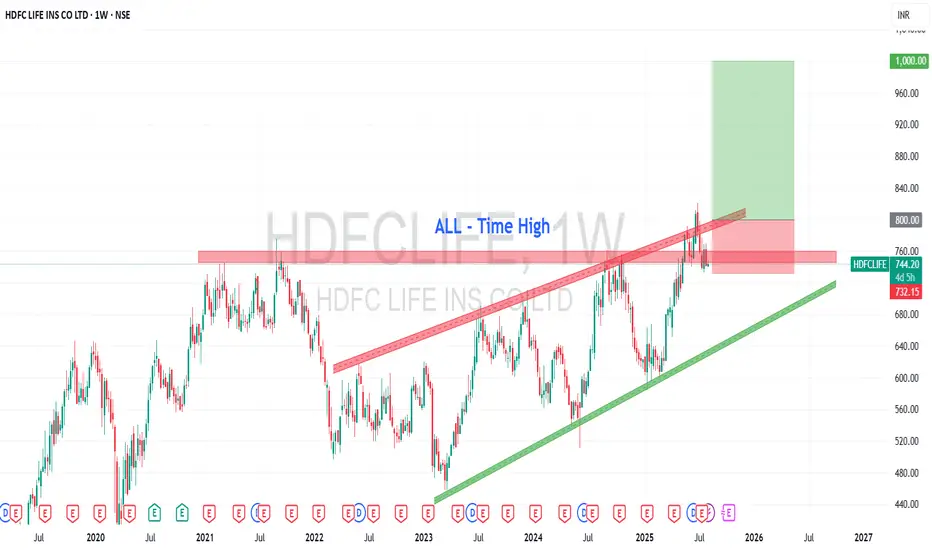
The stock had faced resistance in the ₹750–₹775 range since its all-time high in August 2021. In May 2025, this zone was decisively broken on expectations of a strong Q1 FY26—and Q1 results (announced 15 July) were indeed positive.
Now trading around ₹741, the breakout suggests renewed bullish momentum.
✅Bullish Setup: If the breakout level sustains and acts as support with confirmation from bullish candlestick patterns, we may see moves to:
🎯Target 1: ₹800
🎯Target 2: ₹900
🎯Target 3: ₹1,000
🚨Caution Levels:
Minor stop‑loss: ₹650
Major demand zone: ₹580
A drop below ₹700 undermines the bullish thesis, especially if ₹650 fails to hold and the major demand level is 580
💰Q1 FY26 Financial Highlights (vs Q4 FY25 & Q1 FY25)
- Total Income: ₹29,463 Cr (↑+22% vs ₹24,191 Cr; ↑+9.5% vs ₹26,934 Cr)
- Total Expenses: ₹29,024 Cr (↑+22% vs ₹23,814 Cr; ↑+9% vs ₹26,623 Cr)
- Operating Profits: ₹439 Cr (↑+16% vs ₹377 Cr; ↑+41% vs ₹311 Cr)
- Profit Before Tax: ₹604 Cr (↑+21% vs ₹500 Cr; ↑+51% vs ₹401 Cr)
- Profit After Tax: ₹548 Cr (↑+15% vs ₹475 Cr; ↑+14% vs ₹479 Cr)
- Diluted EPS: ₹2.54 (↑+15% vs ₹2.21; ↑+14% vs ₹2.23)
🧠Fundamental HighlightsProfit Growth: Q1 PAT rose ~14.4% YoY to ₹546 Cr on strong generation from back-book profits and expanded net premiums
Premium Momentum: Individual Annual Premium Equivalent (APE) grew ~12.5–16% YoY, signaling robust retail mix
New Business Value (VNB) estimate around ₹718–834 Cr, growing ~18% YoY
Balance Sheet Health: ROE steady at ~11.2%, D/E ratio approx. 0.18 — reflecting healthy capital structure
🎯Conclusion
HDFC Life has delivered a solid technical breakout, supported by encouraging Q1 financials and strong margin metrics. If the ₹750–₹775 zone now flips to support and holds, the stock could scale toward ₹1,000. However, under ₹650, caution is advised.
Disclaimer:lnkd.in/gJJDnvn2
คำจำกัดสิทธิ์ความรับผิดชอบ
ข้อมูลและบทความไม่ได้มีวัตถุประสงค์เพื่อก่อให้เกิดกิจกรรมทางการเงิน, การลงทุน, การซื้อขาย, ข้อเสนอแนะ หรือคำแนะนำประเภทอื่น ๆ ที่ให้หรือรับรองโดย TradingView อ่านเพิ่มเติมที่ ข้อกำหนดการใช้งาน
คำจำกัดสิทธิ์ความรับผิดชอบ
ข้อมูลและบทความไม่ได้มีวัตถุประสงค์เพื่อก่อให้เกิดกิจกรรมทางการเงิน, การลงทุน, การซื้อขาย, ข้อเสนอแนะ หรือคำแนะนำประเภทอื่น ๆ ที่ให้หรือรับรองโดย TradingView อ่านเพิ่มเติมที่ ข้อกำหนดการใช้งาน