[1] Understanding the Current Setup
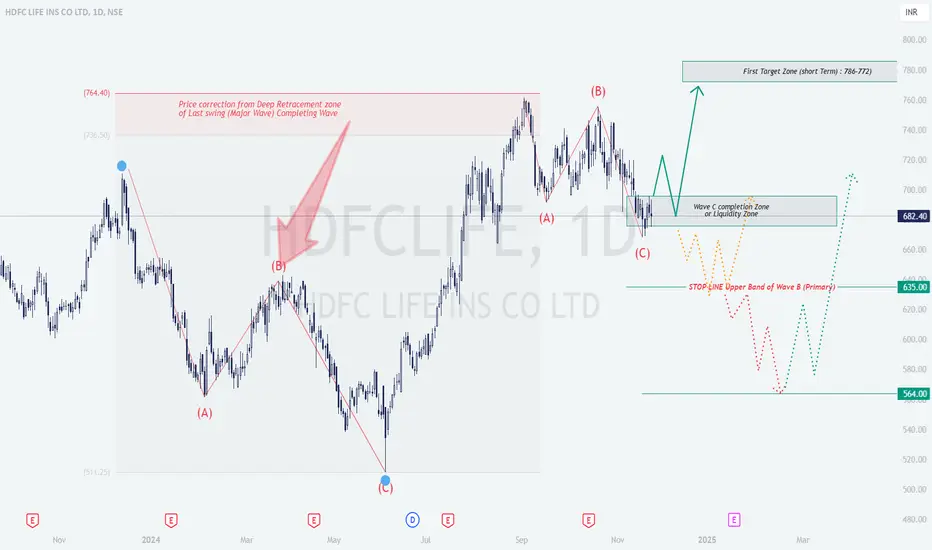
The chart reflects a corrective Elliott Wave structure (ABC pattern):
Wave A: Initial decline from the peak of ₹764.40.
Wave B: Pullback to a resistance zone after Wave A.
Wave C: Continuation of the downtrend, nearing a potential completion zone or liquidity zone around ₹670-680.
The stock is currently consolidating near this Wave C completion zone, signaling a possible reversal to the upside.
[2] Trade Setup Explanation
[3] Technical Analysis Insights
Fibonacci Levels: Wave B retraced deeply (likely 61.8%-78.6% of Wave A). Wave C aligns with extensions (1x or 1.618x of Wave A).
Liquidity Zone: The ₹670-682 zone is a demand area where institutional buying might occur. Look for bullish candlestick patterns for confirmation.
Target Zone: ₹772-786 is a key resistance area, ideal for profit-taking in a bullish scenario.
Stop-Loss Placement: Logical stops are set below the invalidation levels (~₹635 for bulls, ~₹680 for bears).
[4] Prediction and Plan
[5] Educational Takeaway
Elliott Wave Application: Highlights an ABC correction and potential reversal.
Risk Management: Use stop losses at key invalidation levels to minimize risks.
Confirmation Tools: Enhance reliability using indicators like RSI divergence, MACD crossovers, or volume spikes.
Patience: Wait for price action confirmation before entering trades.
This structured plan ensures adaptability to both bullish and bearish scenarios while maintaining disciplined risk management.
The chart reflects a corrective Elliott Wave structure (ABC pattern):
Wave A: Initial decline from the peak of ₹764.40.
Wave B: Pullback to a resistance zone after Wave A.
Wave C: Continuation of the downtrend, nearing a potential completion zone or liquidity zone around ₹670-680.
The stock is currently consolidating near this Wave C completion zone, signaling a possible reversal to the upside.
[2] Trade Setup Explanation
- Bullish Setup:Logic: If Wave C concludes within the Liquidity Zone (~₹670-682), an upward reversal is anticipated toward the first target zone at ₹772-786.
Entry Point: Enter after a clear breakout or reversal signal (e.g., bullish candlestick, trendline breakout, or volume spike).
Targets:
- Target 1: ₹772-786.
- Target 2: Further upside based on price action.
Stop Loss: Below the Wave C lower boundary (~₹635). - Bearish Setup (Alternate Scenario):Logic: A breakdown below ₹635 suggests further downside.
Entry Point: Short on confirmation of a breach below ₹635.
Target: Next support zone at ₹564.
Stop Loss: Above the Liquidity Zone (~₹680).
[3] Technical Analysis Insights
Fibonacci Levels: Wave B retraced deeply (likely 61.8%-78.6% of Wave A). Wave C aligns with extensions (1x or 1.618x of Wave A).
Liquidity Zone: The ₹670-682 zone is a demand area where institutional buying might occur. Look for bullish candlestick patterns for confirmation.
Target Zone: ₹772-786 is a key resistance area, ideal for profit-taking in a bullish scenario.
Stop-Loss Placement: Logical stops are set below the invalidation levels (~₹635 for bulls, ~₹680 for bears).
[4] Prediction and Plan
- []Primary Scenario (Bullish): Wave C completes in the Liquidity Zone, leading to a reversal targeting ₹772-786.
[]Alternate Scenario (Bearish): Breakdown below ₹635 invalidates the bullish outlook, with potential downside to ₹564.
[5] Educational Takeaway
Elliott Wave Application: Highlights an ABC correction and potential reversal.
Risk Management: Use stop losses at key invalidation levels to minimize risks.
Confirmation Tools: Enhance reliability using indicators like RSI divergence, MACD crossovers, or volume spikes.
Patience: Wait for price action confirmation before entering trades.
This structured plan ensures adaptability to both bullish and bearish scenarios while maintaining disciplined risk management.
คำจำกัดสิทธิ์ความรับผิดชอบ
ข้อมูลและบทความไม่ได้มีวัตถุประสงค์เพื่อก่อให้เกิดกิจกรรมทางการเงิน, การลงทุน, การซื้อขาย, ข้อเสนอแนะ หรือคำแนะนำประเภทอื่น ๆ ที่ให้หรือรับรองโดย TradingView อ่านเพิ่มเติมที่ ข้อกำหนดการใช้งาน
คำจำกัดสิทธิ์ความรับผิดชอบ
ข้อมูลและบทความไม่ได้มีวัตถุประสงค์เพื่อก่อให้เกิดกิจกรรมทางการเงิน, การลงทุน, การซื้อขาย, ข้อเสนอแนะ หรือคำแนะนำประเภทอื่น ๆ ที่ให้หรือรับรองโดย TradingView อ่านเพิ่มเติมที่ ข้อกำหนดการใช้งาน