GSFC chart showing a hidden setup… Is this the breakout moment?
GSFC Chart Update (4H Timeframe)
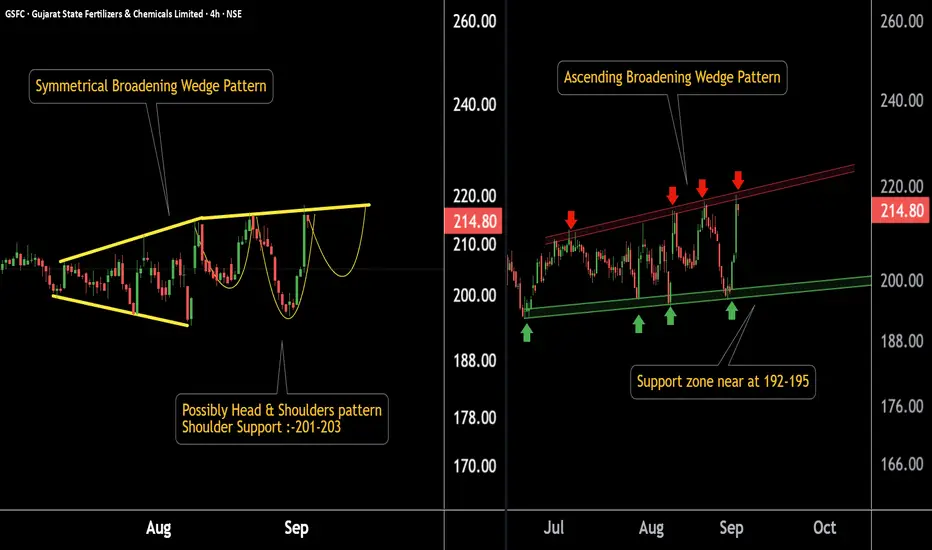
Chart 1:
Stock has formed a symmetrical broadening wedge.
If the stock respects the resistance, there is a possibility of a Head & Shoulders pattern.
Key support zone: 202 – 204.
Chart 2:
GSFC is forming an ascending broadening wedge pattern.
Support lies in the 192 – 195 range.
If this level sustains, potential pattern target is around 240.
Thank You !!
@RahulSaraoge
Connect us at t.me/stridesadvisory
Connect us at t.me/stridesadvisory
คำจำกัดสิทธิ์ความรับผิดชอบ
ข้อมูลและบทความไม่ได้มีวัตถุประสงค์เพื่อก่อให้เกิดกิจกรรมทางการเงิน, การลงทุน, การซื้อขาย, ข้อเสนอแนะ หรือคำแนะนำประเภทอื่น ๆ ที่ให้หรือรับรองโดย TradingView อ่านเพิ่มเติมใน ข้อกำหนดการใช้งาน