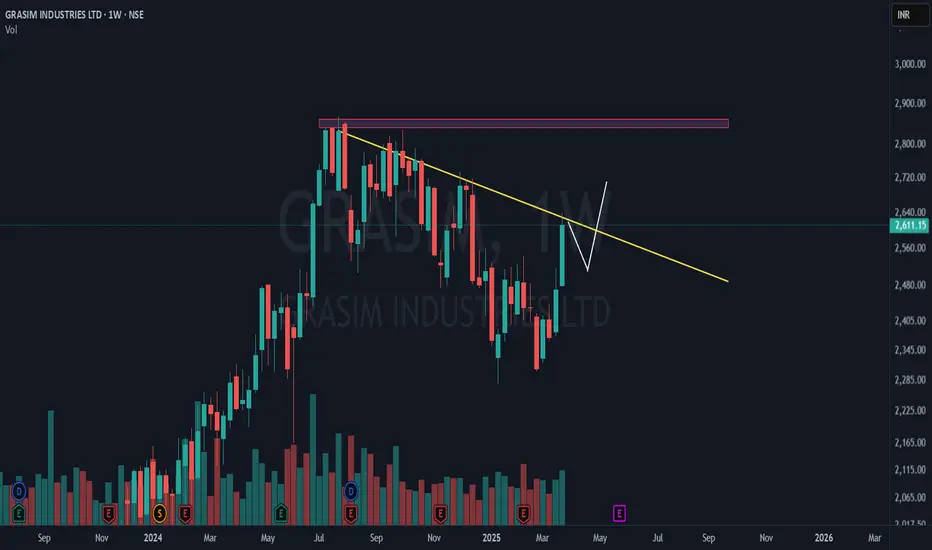
📌 yellow counter trendline (ct) – A key resistance trendline on the weekly timeframe (wtf), which the stock is currently holding at. A breakout is pending .
📌 double bottom breakout – The stock has already rallied significantly after breaking out from a double bottom pattern. However, it's now in a crucial consolidation phase, needing a halt .
📌 price action roadmap – The current structure suggests either a consolidation or a minor dip, followed by a potential breakout above the yellow ct.
📌 red supply zone = major resistance – This area marks both the weekly timeframe all-time high (wtf ath) and multi-timeframe (mtf) resistance, making it a critical level to watch.
A clean breakout from here could be an "ice-break" move! 🚀 Will it break and fly or face rejection? 🤔
🎯 Master My Self-Made Trading Strategy
📈 Telegram (Learn Today): t.me/hashtaghammer
✅ WhatsApp (Learn Today): wa.me/919455664601
📈 Telegram (Learn Today): t.me/hashtaghammer
✅ WhatsApp (Learn Today): wa.me/919455664601
การนำเสนอที่เกี่ยวข้อง
คำจำกัดสิทธิ์ความรับผิดชอบ
ข้อมูลและบทความไม่ได้มีวัตถุประสงค์เพื่อก่อให้เกิดกิจกรรมทางการเงิน, การลงทุน, การซื้อขาย, ข้อเสนอแนะ หรือคำแนะนำประเภทอื่น ๆ ที่ให้หรือรับรองโดย TradingView อ่านเพิ่มเติมใน ข้อกำหนดการใช้งาน