The Setup: Breakout from the Base
GPPL has spent the last year consolidating after a sharp correction from its 2024 high. The chart shows a strong attempt to transition from a corrective phase into a new uptrend (often called a Stage 1 to Stage 2 transition).
Key Technical Confirmation
The Trade Plan
The trade is a continuation play, betting on the momentum established by the recent breakout.
Potential Risks & Cautionary Notes
#Disclaimer: This is for educational and observation purposes only and is not financial advice. Trade at your own risk.
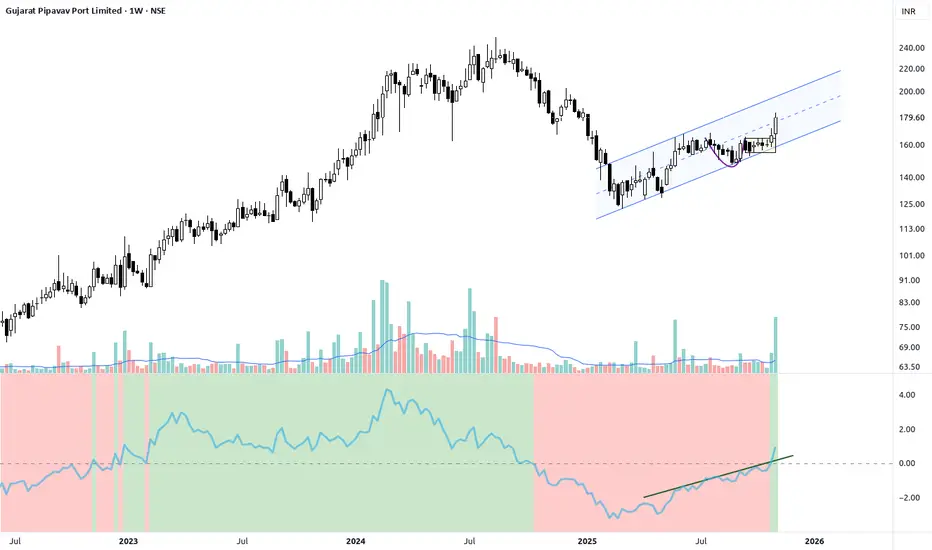
GPPL has spent the last year consolidating after a sharp correction from its 2024 high. The chart shows a strong attempt to transition from a corrective phase into a new uptrend (often called a Stage 1 to Stage 2 transition).
- The Consolidation: The stock established a wide, multi-month base (roughly between ₹125 and ₹160). This base successfully absorbed selling pressure and built a foundation for the next move.
- The Breakout: The recent move has successfully powered the price above the ₹160 overhead supply zone, confirming the breakout from this major base.
- The Follow-Through: The price is now trading within a bullish channel (indicated by the blue parallel lines) and is holding its momentum well above the former resistance.
Key Technical Confirmation
- Moving Averages: The price is now trading above all key moving averages. Crucially, the short-term MAs (blue and red) have crossed above the longer-term MAs (green and orange), confirming the shift to an uptrend (bullish crossover).
- Relative Strength: The Relative Strength line (bottom panel) has turned positive and is visibly trending upward (the green line). This is a vital sign that the stock is outperforming the Nifty and is becoming a market leader.
- Volume: The breakout from the base was accompanied by a clear surge in volume, validating the institutional interest behind the move.
The Trade Plan
The trade is a continuation play, betting on the momentum established by the recent breakout.
- Entry Signal: Enter around the current weekly close.
- Stop Loss (Risk Management): Place a clear, objective stop loss below the key breakout zone, for example, around ₹159 - ₹169. This preserves a strong risk/reward profile.
- Target Expectation: The initial target is the Weak High near ₹240. If the stock can clear this historical pivot, the potential is for a strong, sustained run into new All-Time Highs.
Potential Risks & Cautionary Notes
- Failed Breakout: The primary risk is if the stock fails to sustain momentum and closes back below the major support at ₹160. This would signal a false breakout and invalidate the current bullish thesis.
- Channel Breakdown: A break below the lower trendline of the current channel structure would be an early warning sign of loss of momentum.
- Sector Volatility: Port and logistics stocks can be sensitive to trade and global economic figures. Be aware of any macro changes that could affect the sector.
#Disclaimer: This is for educational and observation purposes only and is not financial advice. Trade at your own risk.
คำจำกัดสิทธิ์ความรับผิดชอบ
ข้อมูลและบทความไม่ได้มีวัตถุประสงค์เพื่อก่อให้เกิดกิจกรรมทางการเงิน, การลงทุน, การซื้อขาย, ข้อเสนอแนะ หรือคำแนะนำประเภทอื่น ๆ ที่ให้หรือรับรองโดย TradingView อ่านเพิ่มเติมใน ข้อกำหนดการใช้งาน
คำจำกัดสิทธิ์ความรับผิดชอบ
ข้อมูลและบทความไม่ได้มีวัตถุประสงค์เพื่อก่อให้เกิดกิจกรรมทางการเงิน, การลงทุน, การซื้อขาย, ข้อเสนอแนะ หรือคำแนะนำประเภทอื่น ๆ ที่ให้หรือรับรองโดย TradingView อ่านเพิ่มเติมใน ข้อกำหนดการใช้งาน