Watching $256–$259 as the Key Battleground Zone 🔍
1. Market Structure (1H & 15M)
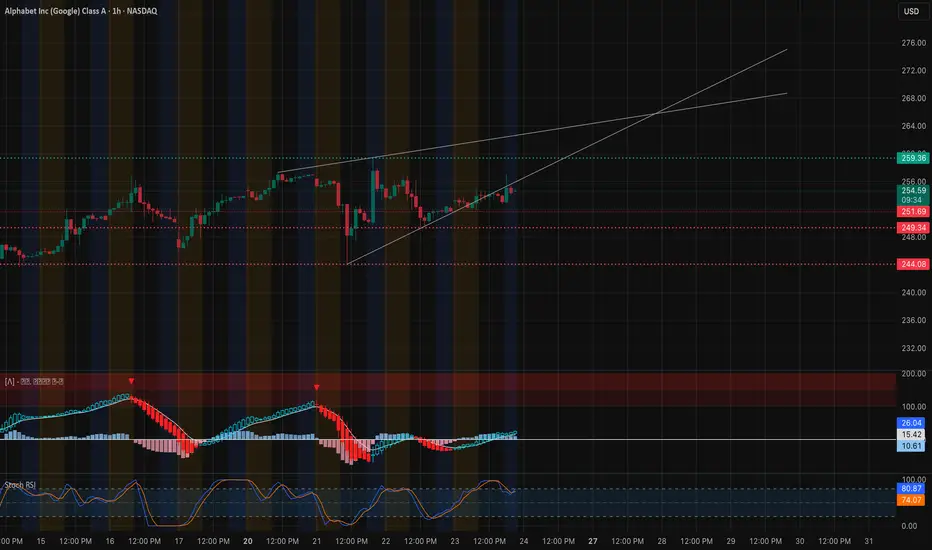
Alphabet (GOOGL) is showing signs of renewed accumulation after rebounding from the $248–$249 support range, where a clear CHoCH confirmed a short-term shift in sentiment. On the 1-hour chart, we can see a rising structure forming, with a BOS at $254.5 followed by a retest of the ascending trendline — a healthy pullback after a prior rally.
Price action remains confined between $248 (demand) and $259 (supply) — a tight compression range that often precedes expansion. The presence of multiple CHoCH and BOS levels suggests smart money is defending dips while gradually building positions ahead of a potential breakout leg.
On the 15-minute chart, intraday CHoCH around $252.5 shows that buyers reclaimed control quickly after a liquidity sweep. As long as price holds above $251.5–$252, short-term bias stays constructive heading into Friday’s session.

2. Supply and Demand / Order Blocks
* Demand Zone: $248–$252 — major high-confluence demand aligned with previous CHoCH zone and FVG (fair value gap). This zone marks the critical level for buyers to defend.
* Immediate Support: $252.5 — where both 15M and 1H EMAs align, acting as short-term dynamic support.
* Supply Zone: $256–$259 — overlapping with previous swing high structure and multiple BOS points, making it the area where sellers are most likely to react first.
A confirmed breakout above $259.3 with volume would invalidate the current compression phase and likely trigger a momentum run toward $265–$268 — which coincides with the next gamma and call wall zone.
3. Indicator Confluence
* 9 EMA / 21 EMA: Both EMAs are now turning upward and close to crossing bullishly on the 1H chart, signaling momentum recovery after a three-day base-building phase. On 15M, the 9EMA is already leading with price maintaining higher lows — confirming micro bullish structure.
* MACD: On both 1H and 15M, MACD is curling upward after resetting — the histogram flipped positive again, a sign of fresh momentum.
* RSI: 1H RSI reads around 70, consistent with bullish control. 15M RSI sits between 55–60, showing equilibrium before potential continuation.
* Volume: Gradually increasing as price tests higher support — typical pre-breakout accumulation pattern.
4. GEX (Gamma Exposure) & Options Sentiment

Friday’s GEX map shows concentrated call resistance between $255–$260, forming the main barrier. The highest positive gamma aligns perfectly with $255–$256, implying that this zone is both a magnet and a resistance pivot for dealer positioning.
Below, the PUT support and HVL (High Volume Level) cluster around $248–$250, making this the “floor” of the current gamma range. If GOOGL holds above that level, dealers’ hedging flow should favor stability or slow upside grinding.
IVR at 47.3 and IVX avg at 44.7 (-2.5%) show compressed volatility, often a precursor to sharp directional moves. The options sentiment leans 32.4% toward calls, not excessive but enough to suggest early bullish repositioning.
A decisive move through $259 could trigger a gamma flip and accelerate hedging demand, pushing GOOGL toward the next gamma node near $265–$268.
5. Trade Scenarios for Friday, Oct. 24
Bullish Setup 🟩
* Entry Zone: $252–$253 retest or breakout confirmation above $256
* Targets: $259 → $263 → $268
* Stop-Loss: Below $250.5
* Confirmation: MACD histogram turns positive, RSI holds >60, and price maintains above 9EMA on 15M
Bearish Setup 🟥
* Entry Zone: $256–$258 rejection area
* Targets: $252 → $249 → $245
* Stop-Loss: Above $259.5
* Confirmation: CHoCH + bearish MACD crossover on 15M
6. Closing Outlook for Oct. 24 (Friday)
Friday looks like a make-or-break day for GOOGL. The stock has been quietly consolidating between $248 and $259 for several sessions — building energy for the next trend leg. As long as $251–$252 holds, the path of least resistance remains to the upside.
If bulls can break through $259 with volume, expect acceleration toward $265–$268 as gamma flows shift supportive. Conversely, a failure to hold above $252 could signal another liquidity sweep down to the $245–$247 range before buyers step in again.
My personal view: GOOGL looks constructively bullish with structure tightening and momentum curling higher. The $255 pivot is key — reclaim and hold that, and a breakout run becomes highly probable.
💬 Final Thought: “GOOGL is compressing between $252 and $259 — the spring is winding tight. A clean breakout over $259 could unleash a sharp move toward $265+. Watch the volume — that’s your tell.”
This analysis is for educational purposes only and not financial advice. Always do your own research and manage your risk before trading.
1. Market Structure (1H & 15M)
Alphabet (GOOGL) is showing signs of renewed accumulation after rebounding from the $248–$249 support range, where a clear CHoCH confirmed a short-term shift in sentiment. On the 1-hour chart, we can see a rising structure forming, with a BOS at $254.5 followed by a retest of the ascending trendline — a healthy pullback after a prior rally.
Price action remains confined between $248 (demand) and $259 (supply) — a tight compression range that often precedes expansion. The presence of multiple CHoCH and BOS levels suggests smart money is defending dips while gradually building positions ahead of a potential breakout leg.
On the 15-minute chart, intraday CHoCH around $252.5 shows that buyers reclaimed control quickly after a liquidity sweep. As long as price holds above $251.5–$252, short-term bias stays constructive heading into Friday’s session.
2. Supply and Demand / Order Blocks
* Demand Zone: $248–$252 — major high-confluence demand aligned with previous CHoCH zone and FVG (fair value gap). This zone marks the critical level for buyers to defend.
* Immediate Support: $252.5 — where both 15M and 1H EMAs align, acting as short-term dynamic support.
* Supply Zone: $256–$259 — overlapping with previous swing high structure and multiple BOS points, making it the area where sellers are most likely to react first.
A confirmed breakout above $259.3 with volume would invalidate the current compression phase and likely trigger a momentum run toward $265–$268 — which coincides with the next gamma and call wall zone.
3. Indicator Confluence
* 9 EMA / 21 EMA: Both EMAs are now turning upward and close to crossing bullishly on the 1H chart, signaling momentum recovery after a three-day base-building phase. On 15M, the 9EMA is already leading with price maintaining higher lows — confirming micro bullish structure.
* MACD: On both 1H and 15M, MACD is curling upward after resetting — the histogram flipped positive again, a sign of fresh momentum.
* RSI: 1H RSI reads around 70, consistent with bullish control. 15M RSI sits between 55–60, showing equilibrium before potential continuation.
* Volume: Gradually increasing as price tests higher support — typical pre-breakout accumulation pattern.
4. GEX (Gamma Exposure) & Options Sentiment
Friday’s GEX map shows concentrated call resistance between $255–$260, forming the main barrier. The highest positive gamma aligns perfectly with $255–$256, implying that this zone is both a magnet and a resistance pivot for dealer positioning.
Below, the PUT support and HVL (High Volume Level) cluster around $248–$250, making this the “floor” of the current gamma range. If GOOGL holds above that level, dealers’ hedging flow should favor stability or slow upside grinding.
IVR at 47.3 and IVX avg at 44.7 (-2.5%) show compressed volatility, often a precursor to sharp directional moves. The options sentiment leans 32.4% toward calls, not excessive but enough to suggest early bullish repositioning.
A decisive move through $259 could trigger a gamma flip and accelerate hedging demand, pushing GOOGL toward the next gamma node near $265–$268.
5. Trade Scenarios for Friday, Oct. 24
Bullish Setup 🟩
* Entry Zone: $252–$253 retest or breakout confirmation above $256
* Targets: $259 → $263 → $268
* Stop-Loss: Below $250.5
* Confirmation: MACD histogram turns positive, RSI holds >60, and price maintains above 9EMA on 15M
Bearish Setup 🟥
* Entry Zone: $256–$258 rejection area
* Targets: $252 → $249 → $245
* Stop-Loss: Above $259.5
* Confirmation: CHoCH + bearish MACD crossover on 15M
6. Closing Outlook for Oct. 24 (Friday)
Friday looks like a make-or-break day for GOOGL. The stock has been quietly consolidating between $248 and $259 for several sessions — building energy for the next trend leg. As long as $251–$252 holds, the path of least resistance remains to the upside.
If bulls can break through $259 with volume, expect acceleration toward $265–$268 as gamma flows shift supportive. Conversely, a failure to hold above $252 could signal another liquidity sweep down to the $245–$247 range before buyers step in again.
My personal view: GOOGL looks constructively bullish with structure tightening and momentum curling higher. The $255 pivot is key — reclaim and hold that, and a breakout run becomes highly probable.
💬 Final Thought: “GOOGL is compressing between $252 and $259 — the spring is winding tight. A clean breakout over $259 could unleash a sharp move toward $265+. Watch the volume — that’s your tell.”
This analysis is for educational purposes only and not financial advice. Always do your own research and manage your risk before trading.
คำจำกัดสิทธิ์ความรับผิดชอบ
ข้อมูลและบทความไม่ได้มีวัตถุประสงค์เพื่อก่อให้เกิดกิจกรรมทางการเงิน, การลงทุน, การซื้อขาย, ข้อเสนอแนะ หรือคำแนะนำประเภทอื่น ๆ ที่ให้หรือรับรองโดย TradingView อ่านเพิ่มเติมใน ข้อกำหนดการใช้งาน
คำจำกัดสิทธิ์ความรับผิดชอบ
ข้อมูลและบทความไม่ได้มีวัตถุประสงค์เพื่อก่อให้เกิดกิจกรรมทางการเงิน, การลงทุน, การซื้อขาย, ข้อเสนอแนะ หรือคำแนะนำประเภทอื่น ๆ ที่ให้หรือรับรองโดย TradingView อ่านเพิ่มเติมใน ข้อกำหนดการใช้งาน