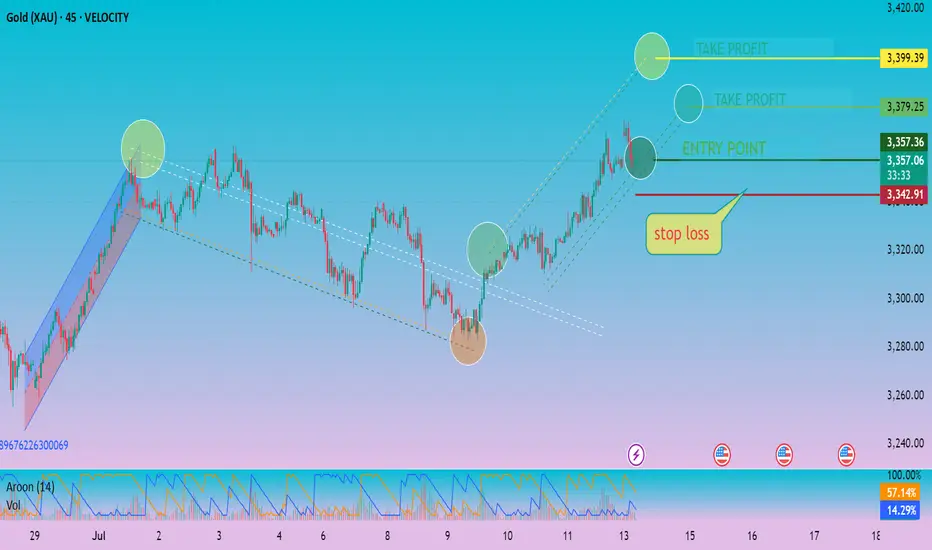
This chart is a technical analysis of Gold (XAU/USD) on a 45-minute timeframe using TradingView, as of July 14, 2025. It includes indicators, price action patterns, trend channels, and annotated trading levels.
---
🔍 1. Chart Overview
Asset: Gold (XAU/USD)
Timeframe: 45-minute
Current Price: ~$3,357.43
Trend Bias: Bullish in the short term (current price is rising within an ascending channel)
---
📈 2. Trend & Price Action
✅ Uptrend Formation
The chart shows a downtrend reversal around July 9, with the price forming a V-shaped recovery.
The breakout from the descending channel around July 9 marks the reversal confirmation.
Price is now trading in an ascending parallel channel, indicating a bullish trend.
✅ Entry Point
The ENTRY POINT is marked at ~3,357.36.
This was identified after a strong breakout and retest of the ascending channel support.
❗ Stop Loss
Stop Loss: Placed at ~3,342.91, just below the lower bound of the ascending channel.
It’s a reasonable level to cut losses if the price drops below key support.
---
🎯 3. Take Profit Levels
There are two take profit (TP) levels:
Target Level Notes
TP1 3,379.25 Conservative target within channel
TP2 3,399.39 Aggressive target at channel top
Both are logical based on channel projection and recent highs.
---
📊 4. Indicators & Volume
📉 Aroon Indicator (bottom pane)
Aroon Up (blue): ~14%
Aroon Down (orange): ~57%
This shows recent bullish strength is weakening, but no strong trend reversal yet.
🔊 Volume
Steady volume, no sharp spikes indicating overbought conditions.
Volume increased slightly on the breakout, confirming the strength of the bullish move.
---
📐 5. Patterns and Tools
Falling Channel: Broken upward, which often indicates a bullish reversal.
Rising Channel (current): Being respected; price is climbing within this channel.
Support & Resistance: Well-defined entry, SL, and TP levels.
Highlight Circles: Emphasize key turning points and breakout zones.
---
🧠 6. Strategy Summary
🟩 Bullish Setup
Entry: Taken after breakout and confirmation.
Stop Loss: Strategically placed to minimize risk.
Profit Targets: Allow scaling out based on risk tolerance.
---
⚠ 7. Risks & Considerations
The Aroon indicator shows fading bullish momentum.
If price breaks below the lower ascending channel line, consider exiting or re-evaluating.
Watch for volume spikes or reversal candles near the TP zones.
---
✅ Conclusion
This chart suggests a well-structured long (buy) trade based on:
Technical breakout
Channel formation
Defined entry/exit points
As long as price remains above ~3,343, the bullish outlook is valid. Be cautious around resistance levels (~3,379 and ~3,399), and adjust SL or TP dynamically if volatility increases.
Let me know if you want a trade plan or risk-reward ratio breakdown.
---
🔍 1. Chart Overview
Asset: Gold (XAU/USD)
Timeframe: 45-minute
Current Price: ~$3,357.43
Trend Bias: Bullish in the short term (current price is rising within an ascending channel)
---
📈 2. Trend & Price Action
✅ Uptrend Formation
The chart shows a downtrend reversal around July 9, with the price forming a V-shaped recovery.
The breakout from the descending channel around July 9 marks the reversal confirmation.
Price is now trading in an ascending parallel channel, indicating a bullish trend.
✅ Entry Point
The ENTRY POINT is marked at ~3,357.36.
This was identified after a strong breakout and retest of the ascending channel support.
❗ Stop Loss
Stop Loss: Placed at ~3,342.91, just below the lower bound of the ascending channel.
It’s a reasonable level to cut losses if the price drops below key support.
---
🎯 3. Take Profit Levels
There are two take profit (TP) levels:
Target Level Notes
TP1 3,379.25 Conservative target within channel
TP2 3,399.39 Aggressive target at channel top
Both are logical based on channel projection and recent highs.
---
📊 4. Indicators & Volume
📉 Aroon Indicator (bottom pane)
Aroon Up (blue): ~14%
Aroon Down (orange): ~57%
This shows recent bullish strength is weakening, but no strong trend reversal yet.
🔊 Volume
Steady volume, no sharp spikes indicating overbought conditions.
Volume increased slightly on the breakout, confirming the strength of the bullish move.
---
📐 5. Patterns and Tools
Falling Channel: Broken upward, which often indicates a bullish reversal.
Rising Channel (current): Being respected; price is climbing within this channel.
Support & Resistance: Well-defined entry, SL, and TP levels.
Highlight Circles: Emphasize key turning points and breakout zones.
---
🧠 6. Strategy Summary
🟩 Bullish Setup
Entry: Taken after breakout and confirmation.
Stop Loss: Strategically placed to minimize risk.
Profit Targets: Allow scaling out based on risk tolerance.
---
⚠ 7. Risks & Considerations
The Aroon indicator shows fading bullish momentum.
If price breaks below the lower ascending channel line, consider exiting or re-evaluating.
Watch for volume spikes or reversal candles near the TP zones.
---
✅ Conclusion
This chart suggests a well-structured long (buy) trade based on:
Technical breakout
Channel formation
Defined entry/exit points
As long as price remains above ~3,343, the bullish outlook is valid. Be cautious around resistance levels (~3,379 and ~3,399), and adjust SL or TP dynamically if volatility increases.
Let me know if you want a trade plan or risk-reward ratio breakdown.
คำจำกัดสิทธิ์ความรับผิดชอบ
ข้อมูลและบทความไม่ได้มีวัตถุประสงค์เพื่อก่อให้เกิดกิจกรรมทางการเงิน, การลงทุน, การซื้อขาย, ข้อเสนอแนะ หรือคำแนะนำประเภทอื่น ๆ ที่ให้หรือรับรองโดย TradingView อ่านเพิ่มเติมที่ ข้อกำหนดการใช้งาน
คำจำกัดสิทธิ์ความรับผิดชอบ
ข้อมูลและบทความไม่ได้มีวัตถุประสงค์เพื่อก่อให้เกิดกิจกรรมทางการเงิน, การลงทุน, การซื้อขาย, ข้อเสนอแนะ หรือคำแนะนำประเภทอื่น ๆ ที่ให้หรือรับรองโดย TradingView อ่านเพิ่มเติมที่ ข้อกำหนดการใช้งาน