Gujarat Mineral Development Corporation Ltd – Range Breakout on Radar
 GMDCLTD
📈 Pattern & Setup:
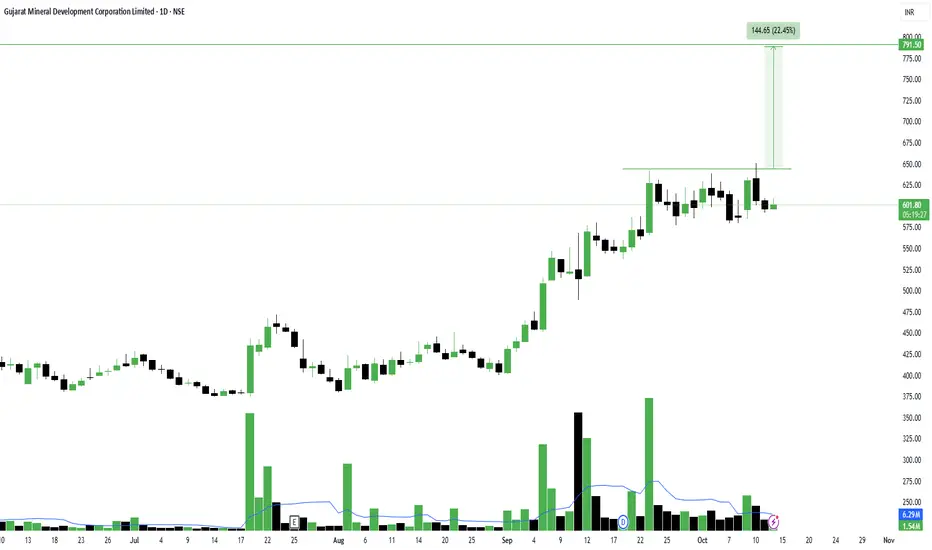
GMDC has been consolidating in a tight range for the past few weeks after a sharp rally from its September lows. The stock faced resistance near 645–650 multiple times, forming a well-defined horizontal base while maintaining higher lows — a sign of strength and controlled accumulation.
The recent shakeouts near the moving averages successfully absorbed supply, with buyers stepping back in to defend the 600 zone. Price is now coiling just below resistance, suggesting a potential breakout setup in the making.
📝 Trade Plan:
✍Entry: Above 650 (breakout confirmation)
🚩Stop-Loss: 600 (below recent shakeout low)
🎯Targets:
Target 1 → 720
Target 2 → 790 (22% potential move)
💡 Pyramiding Strategy:
1. Enter with 60% position once it closes above 650
2. Add remaining 40% above 670 with volume confirmation
3. Trail stop-loss to 615 once price sustains above 690
🧠 Logic Behind Selecting this Trade:
This structure highlights textbook re-accumulation after a strong trend. The tight consolidation zone, clean moving average alignment, and controlled pullbacks point to steady institutional interest. With volumes gradually increasing near support, the next leg higher could be triggered by a close above the range top.
Keep Learning. Keep Earning.
Let’s grow together 📚🎯
🔴Disclaimer:
This analysis is for educational purposes only. Not a buy/sell recommendation. Please do your own research or consult your financial advisor before trading.
📈 Pattern & Setup:
GMDC has been consolidating in a tight range for the past few weeks after a sharp rally from its September lows. The stock faced resistance near 645–650 multiple times, forming a well-defined horizontal base while maintaining higher lows — a sign of strength and controlled accumulation.
The recent shakeouts near the moving averages successfully absorbed supply, with buyers stepping back in to defend the 600 zone. Price is now coiling just below resistance, suggesting a potential breakout setup in the making.
📝 Trade Plan:
✍Entry: Above 650 (breakout confirmation)
🚩Stop-Loss: 600 (below recent shakeout low)
🎯Targets:
Target 1 → 720
Target 2 → 790 (22% potential move)
💡 Pyramiding Strategy:
1. Enter with 60% position once it closes above 650
2. Add remaining 40% above 670 with volume confirmation
3. Trail stop-loss to 615 once price sustains above 690
🧠 Logic Behind Selecting this Trade:
This structure highlights textbook re-accumulation after a strong trend. The tight consolidation zone, clean moving average alignment, and controlled pullbacks point to steady institutional interest. With volumes gradually increasing near support, the next leg higher could be triggered by a close above the range top.
Keep Learning. Keep Earning.
Let’s grow together 📚🎯
🔴Disclaimer:
This analysis is for educational purposes only. Not a buy/sell recommendation. Please do your own research or consult your financial advisor before trading.
TrendX INC
คำจำกัดสิทธิ์ความรับผิดชอบ
ข้อมูลและบทความไม่ได้มีวัตถุประสงค์เพื่อก่อให้เกิดกิจกรรมทางการเงิน, การลงทุน, การซื้อขาย, ข้อเสนอแนะ หรือคำแนะนำประเภทอื่น ๆ ที่ให้หรือรับรองโดย TradingView อ่านเพิ่มเติมใน ข้อกำหนดการใช้งาน
TrendX INC
คำจำกัดสิทธิ์ความรับผิดชอบ
ข้อมูลและบทความไม่ได้มีวัตถุประสงค์เพื่อก่อให้เกิดกิจกรรมทางการเงิน, การลงทุน, การซื้อขาย, ข้อเสนอแนะ หรือคำแนะนำประเภทอื่น ๆ ที่ให้หรือรับรองโดย TradingView อ่านเพิ่มเติมใน ข้อกำหนดการใช้งาน