GMAB at a Critical Confluence Zone – Potential Breakout or Reversal?
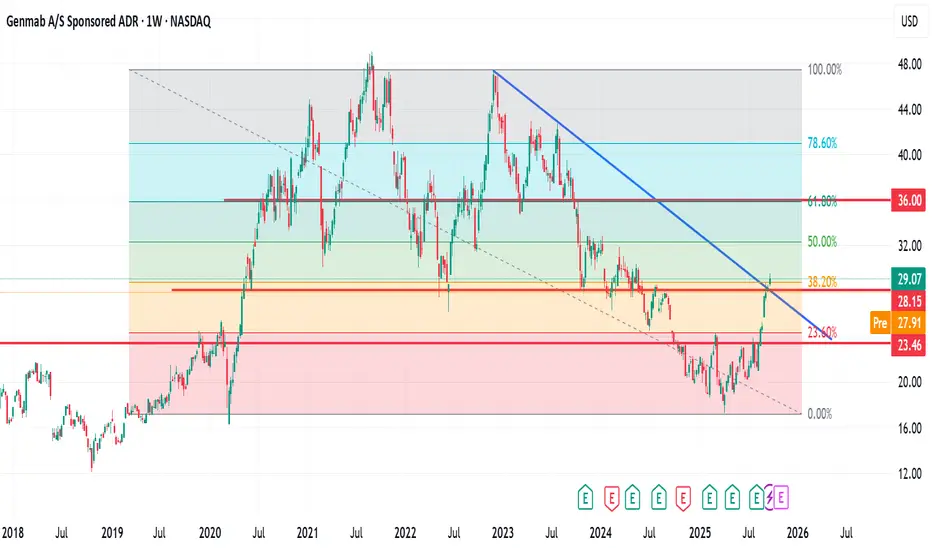
GMAB has shown strong recovery momentum since its April 7th, 2025, low. The price is currently testing a significant confluence area formed by a descending trendline and the Fib 38.2% support level.
If price action holds above this zone, there is potential for a continuation move toward the Fib 61.8% level, which would represent an estimated upside of around 28%.
My Trade Plan:
Initial entry at the current market cap.
Second entry after a confirmed breakout above this confluence zone.
As always, apply proper risk management—trade cautiously and according to your strategy.
🔹 Like, comment, and follow for more trade ideas.
🔹 Let’s connect here on TradingView.
บันทึก
Playing outการนำเสนอที่เกี่ยวข้อง
คำจำกัดสิทธิ์ความรับผิดชอบ
ข้อมูลและบทความไม่ได้มีวัตถุประสงค์เพื่อก่อให้เกิดกิจกรรมทางการเงิน, การลงทุน, การซื้อขาย, ข้อเสนอแนะ หรือคำแนะนำประเภทอื่น ๆ ที่ให้หรือรับรองโดย TradingView อ่านเพิ่มเติมใน ข้อกำหนดการใช้งาน
การนำเสนอที่เกี่ยวข้อง
คำจำกัดสิทธิ์ความรับผิดชอบ
ข้อมูลและบทความไม่ได้มีวัตถุประสงค์เพื่อก่อให้เกิดกิจกรรมทางการเงิน, การลงทุน, การซื้อขาย, ข้อเสนอแนะ หรือคำแนะนำประเภทอื่น ๆ ที่ให้หรือรับรองโดย TradingView อ่านเพิ่มเติมใน ข้อกำหนดการใช้งาน