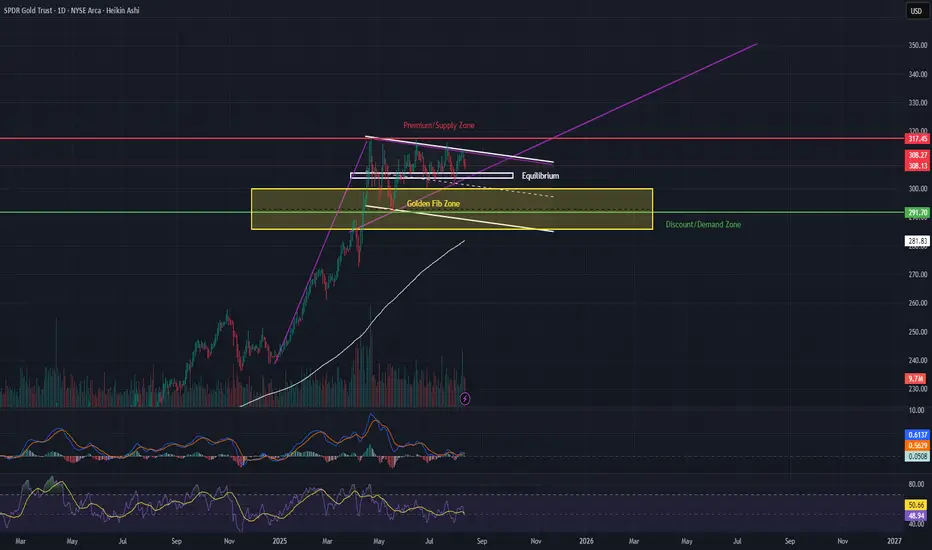
GLD is consolidating within a bullish pennant after its March–April rally, trading near the equilibrium zone (305–307). Price action is tightening, and we’re nearing the apex — meaning a breakout is likely soon.
📈 Bullish Scenario – Bullish Pennant Breakout
Pattern: Bullish pennant, flagpole measured move targets 330–335.
Bullish Entry: On a confirmed daily close above 312–314 with increasing volume.
Take Profits:
1️⃣ TP1: 320 (psychological + resistance)
2️⃣ TP2: 330–335 (measured move target)
Stop Loss: Below 305 (under equilibrium) or conservative SL at 302 (below pennant support).
Why: Holding above equilibrium while contracting in price signals accumulation; breakout could mirror prior leg higher.
📉 Bearish Scenario – Pennant Failure
Bearish Entry: On a daily close below 302–300 with strong sell volume.
Take Profits:
1️⃣ TP1: 292–294 (mid-range)
2️⃣ TP2: 285–290 (discount/demand zone & near 200 EMA)
Stop Loss: Above 307–308 (back inside pennant).
Why: A breakdown here invalidates the bullish pennant and targets deeper retracement toward key support.
💡 Options Trade Ideas
(For traders looking to position with defined risk)
Bullish Breakout Play
Strategy: Buy GLD Calls 4–6 weeks out from breakout confirmation.
Strike: ATM or slightly OTM (e.g., 315C).
Trigger: Break and close above 312–314.
Target Exit: Scale out at 320 and 330–335.
Risk Management: Stop if GLD closes below 305 after breakout.
Bearish Breakdown Play
Strategy: Buy GLD Puts 4–6 weeks out from breakdown confirmation.
Strike: ATM or slightly OTM (e.g., 300P).
Trigger: Break and close below 302–300.
Target Exit: Scale out at 292–294 and 285–290.
Risk Management: Stop if GLD closes above 307 after breakdown.
✨ Golden Fib Zone (Key Confluence Support)
This zone (highlighted in yellow) represents the 61.8% Fibonacci retracement of the March–April rally.
It overlaps with the discount zone and sits just above the discount/demand zone (285–290), making it a high-probability buy area if price pulls back here.
Historically, the Golden Fib acts as a strong reversal area in trending markets, especially when combined with structural support and the 200 EMA.
A bounce from this zone would keep the bullish pennant valid and could serve as a low-risk long entry for swing traders targeting the 320+ zone.
🔍 Key Levels to Watch
Upside: 312.5 → 320 → 330–335
Downside: 305 → 302 → 285–290
⏳ Summary:
GLD is in a pivotal coiling phase. The Golden Fib Zone adds strong confluence for buyers if we see a retracement, while an upside breakout from the pennant could trigger the next leg higher. Either way, this setup is primed for a high-volatility move — be ready for both scenarios.
คำจำกัดสิทธิ์ความรับผิดชอบ
ข้อมูลและบทความไม่ได้มีวัตถุประสงค์เพื่อก่อให้เกิดกิจกรรมทางการเงิน, การลงทุน, การซื้อขาย, ข้อเสนอแนะ หรือคำแนะนำประเภทอื่น ๆ ที่ให้หรือรับรองโดย TradingView อ่านเพิ่มเติมที่ ข้อกำหนดการใช้งาน
คำจำกัดสิทธิ์ความรับผิดชอบ
ข้อมูลและบทความไม่ได้มีวัตถุประสงค์เพื่อก่อให้เกิดกิจกรรมทางการเงิน, การลงทุน, การซื้อขาย, ข้อเสนอแนะ หรือคำแนะนำประเภทอื่น ๆ ที่ให้หรือรับรองโดย TradingView อ่านเพิ่มเติมที่ ข้อกำหนดการใช้งาน