GER40 Technical Analysis: 🇩🇪 At All-Time Highs - Can the DAX Power Higher or Time to Pause? ⏸️
Asset: GER40 (DAX 40 Index CFD)
Analysis Date: September 5, 2025
Current Closing Price: 23,654.5 (as of 11:54 PM UTC+4)
Timeframes Analyzed: 1H, 4H, D, W
Executive Summary & Market Outlook 🧐
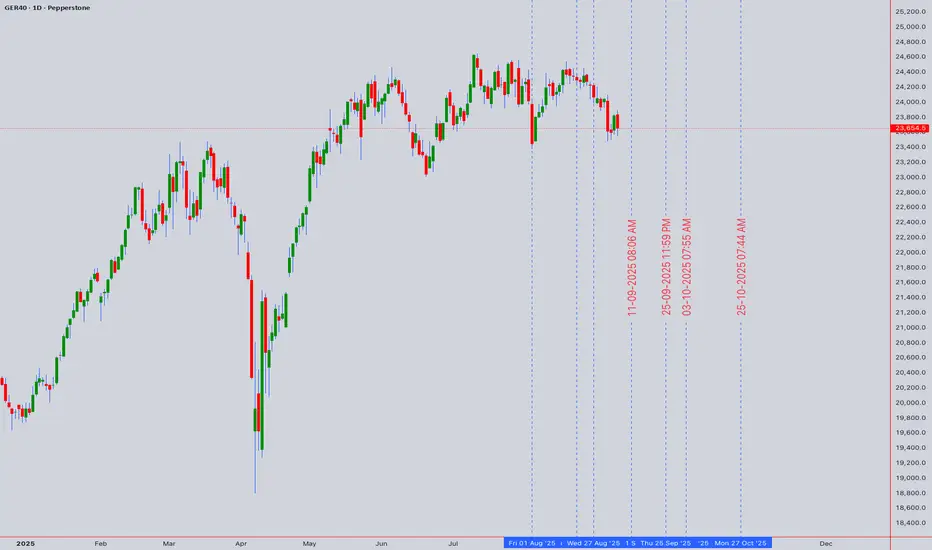
The GER40 is trading at a historic high, showcasing a formidable bullish trend. 🚀 However, the price is now testing a critical psychological resistance zone near 23,700. The rally shows signs of minor exhaustion, with momentum indicators flashing overbought signals. This creates a classic tension between a potential breakout continuation and a healthy pullback. A decisive break above 23,700 could target 24,000, while a rejection may trigger a retracement to gather strength. This analysis provides a clear plan for intraday 🎯 and swing traders 📈.
📈 Quick Summary & Key Takeaways (TL;DR)
🔄 Market State: The DAX is at a critical Gann & Fibonacci confluence zone around 23,650. A decisive break above or below this level will dictate the next major move.
🎯 Primary Bullish Target: A breakout above 23,800 targets 24,200 - 24,500.
⚠️ Primary Bearish Target: A breakdown below 23,500 opens the path to 23,100 - 22,800.
📊 Key Indicator: RSI is neutral but showing early bearish divergence on the 4H chart, suggesting upward momentum is waning.
⭐ Trade of the Week: Short on a rejection from the 23,750-23,800 resistance cluster with a target towards 23,200.
Multi-Timeframe Technical Analysis 🔍
1. Trend Analysis (Daily & 4-Hour Chart):
Primary Trend: 🟢 Strongly Bullish. Price is well above all key Daily Moving Averages (200, 100, 50 EMA), which are fanned out and sloping upwards.
Short-Term Trend: 🟡 Bullish but Overextended. The recent ascent has been steep, suggesting the market may need a brief pause or dip to attract new buyers.
2. Key Chart Patterns & Theories:
Breakout & Consolidation: The index has broken above previous highs and is now consolidating near the peak. This can be interpreted as a bull flag formation, suggesting a potential continuation upon a breakout.
Elliott Wave Theory 🌊: The rally from the last significant low appears to be a clear five-wave impulse. We are likely in the final stages of Wave 5. This implies that while the trend is up, a larger Wave (4) correction is becoming due. A typical retracement target for a Wave 4 is the 38.2% Fibonacci level near 22,800.
Ichimoku Cloud (H4/D1) ☁️: Price is trading high above the Cloud on daily charts, confirming the strong bullish trend. The Lagging Span (Chikou Span) is also clear of price, supporting the bullish bias. However, this extension suggests a pullback to the Cloud is possible.
Gann Theory ⏳: The 23,700 level represents a key psychological and mathematical resistance. A decisive break and close above it could open the path to the next Gann angle target.
3. Critical Support & Resistance Levels:
4. Indicator Consensus:
RSI (14-period on 4H/D): Reading is between 65 and 70, signaling overbought conditions. 📛 This suggests upside momentum may be slowing and warns against chasing longs at these highs.
Bollinger Bands (4H) 📏: Price is riding the upper band, a sign of strong momentum. A move back towards the middle band (20-period SMA) would be a healthy development.
Moving Averages: The bullish alignment (EMA8 > EMA21 > EMA50) is intact. The EMA 21 on the 4H chart acts as crucial dynamic support.
Volume & VWAP: Volume has been respectable on the breakout. The Anchored VWAP from a recent swing low shows price is extended, suggesting a pullback would be healthy.
Trading Strategy & Forecast 🎯
A. Intraday Trading Strategy (5M - 1H Charts):
Bullish Scenario (Breakout Play) ⬆️: A break above 23,700 with increasing volume could trigger a momentum move higher.
Bearish Scenario (Rejection Play) ⬇️: Given overbought conditions, a rejection at this resistance is a valid setup.
B. Swing Trading Strategy (4H - D Charts):
Strategy: WAIT FOR A BETTER ENTRY. The risk/reward for new long entries at this resistance is not optimal. 🚫
Ideal Long Zones: A pullback to the 23,200 - 23,400 support confluence would offer a much higher probability long entry to ride the next leg up. ✅
Bearish Risk: A daily close below 23,000 would signal a deeper correction is likely underway, potentially targeting 22,600.
Risk Management & Conclusion ⚠️
Key Risk Events: European economic data (German Industrial Production, ZEW Survey) and ECB commentary are key drivers. 🔥 As a major export index, the DAX is also highly sensitive to global growth expectations and geopolitical developments.
Position Sizing: Due to the potential for increased volatility at key levels, always use conservative position sizing. Risk no more than 1-2% of your capital on a single trade.
Conclusion: The GER40 is bullish but testing a major ceiling. ⚖️ The trend is your friend, but the smart play here is patience. Swing traders should wait for a pullback to strong support before entering. Intraday traders can play the range between 23,500 and 23,700 until a decisive break occurs. The most probable outcome is a period of consolidation or a shallow pullback before the next major directional move. 📊
Overall Bias: 🟢 Bullish above 23,200 | 🟡 Neutral/Bearish between 23,650-23,700
For individuals seeking to enhance their trading abilities based on the analyses provided, I recommend exploring the mentoring program offered by Shunya Trade. (Website: shunya dot trade)
I would appreciate your feedback on this analysis, as it will serve as a valuable resource for future endeavors.
Sincerely,
Shunya.Trade
Website: shunya dot trade
⚠️Disclaimer: This post is intended solely for educational purposes and does not constitute investment advice, financial advice, or trading recommendations. The views expressed herein are derived from technical analysis and are shared for informational purposes only. The stock market inherently carries risks, including the potential for capital loss. Therefore, readers are strongly advised to exercise prudent judgment before making any investment decisions. We assume no liability for any actions taken based on this content. For personalized guidance, it is recommended to consult a certified financial advisor.
Asset: GER40 (DAX 40 Index CFD)
Analysis Date: September 5, 2025
Current Closing Price: 23,654.5 (as of 11:54 PM UTC+4)
Timeframes Analyzed: 1H, 4H, D, W
Executive Summary & Market Outlook 🧐
The GER40 is trading at a historic high, showcasing a formidable bullish trend. 🚀 However, the price is now testing a critical psychological resistance zone near 23,700. The rally shows signs of minor exhaustion, with momentum indicators flashing overbought signals. This creates a classic tension between a potential breakout continuation and a healthy pullback. A decisive break above 23,700 could target 24,000, while a rejection may trigger a retracement to gather strength. This analysis provides a clear plan for intraday 🎯 and swing traders 📈.
📈 Quick Summary & Key Takeaways (TL;DR)
🔄 Market State: The DAX is at a critical Gann & Fibonacci confluence zone around 23,650. A decisive break above or below this level will dictate the next major move.
🎯 Primary Bullish Target: A breakout above 23,800 targets 24,200 - 24,500.
⚠️ Primary Bearish Target: A breakdown below 23,500 opens the path to 23,100 - 22,800.
📊 Key Indicator: RSI is neutral but showing early bearish divergence on the 4H chart, suggesting upward momentum is waning.
⭐ Trade of the Week: Short on a rejection from the 23,750-23,800 resistance cluster with a target towards 23,200.
Multi-Timeframe Technical Analysis 🔍
1. Trend Analysis (Daily & 4-Hour Chart):
Primary Trend: 🟢 Strongly Bullish. Price is well above all key Daily Moving Averages (200, 100, 50 EMA), which are fanned out and sloping upwards.
Short-Term Trend: 🟡 Bullish but Overextended. The recent ascent has been steep, suggesting the market may need a brief pause or dip to attract new buyers.
2. Key Chart Patterns & Theories:
Breakout & Consolidation: The index has broken above previous highs and is now consolidating near the peak. This can be interpreted as a bull flag formation, suggesting a potential continuation upon a breakout.
Elliott Wave Theory 🌊: The rally from the last significant low appears to be a clear five-wave impulse. We are likely in the final stages of Wave 5. This implies that while the trend is up, a larger Wave (4) correction is becoming due. A typical retracement target for a Wave 4 is the 38.2% Fibonacci level near 22,800.
Ichimoku Cloud (H4/D1) ☁️: Price is trading high above the Cloud on daily charts, confirming the strong bullish trend. The Lagging Span (Chikou Span) is also clear of price, supporting the bullish bias. However, this extension suggests a pullback to the Cloud is possible.
Gann Theory ⏳: The 23,700 level represents a key psychological and mathematical resistance. A decisive break and close above it could open the path to the next Gann angle target.
3. Critical Support & Resistance Levels:
- Resistance (R1): 23,700 - 23,800 (Key Psychological & Technical Ceiling) 🚨
- Resistance (R2): 24,000 (Projected Target)
- Current Closing Price: ~23,654.5
- Support (S1): 23,400 - 23,500 (Immediate Support & 21-period EMA) ✅
- Support (S2): 23,000 - 23,200 (Major Support - 38.2% Fib & Prior Breakout Zone) 🛡️
- Support (S3): 22,600 (50-day EMA & 50% Fib Retracement)
4. Indicator Consensus:
RSI (14-period on 4H/D): Reading is between 65 and 70, signaling overbought conditions. 📛 This suggests upside momentum may be slowing and warns against chasing longs at these highs.
Bollinger Bands (4H) 📏: Price is riding the upper band, a sign of strong momentum. A move back towards the middle band (20-period SMA) would be a healthy development.
Moving Averages: The bullish alignment (EMA8 > EMA21 > EMA50) is intact. The EMA 21 on the 4H chart acts as crucial dynamic support.
Volume & VWAP: Volume has been respectable on the breakout. The Anchored VWAP from a recent swing low shows price is extended, suggesting a pullback would be healthy.
Trading Strategy & Forecast 🎯
A. Intraday Trading Strategy (5M - 1H Charts):
Bullish Scenario (Breakout Play) ⬆️: A break above 23,700 with increasing volume could trigger a momentum move higher.
- Entry: On a small pullback to re-test 23,700 as new support.
- Stop Loss: Below 23,650.
- Target: 23,900 (TP1), 24,000 (TP2).
Bearish Scenario (Rejection Play) ⬇️: Given overbought conditions, a rejection at this resistance is a valid setup.
- Entry: On bearish reversal candlestick patterns (e.g., Bearish Engulfing, Shooting Star 🌠) at 23,700.
- Stop Loss: Tight, above 23,750.
- Target: 23,500 (TP1), 23,400 (TP2).
B. Swing Trading Strategy (4H - D Charts):
Strategy: WAIT FOR A BETTER ENTRY. The risk/reward for new long entries at this resistance is not optimal. 🚫
Ideal Long Zones: A pullback to the 23,200 - 23,400 support confluence would offer a much higher probability long entry to ride the next leg up. ✅
Bearish Risk: A daily close below 23,000 would signal a deeper correction is likely underway, potentially targeting 22,600.
Risk Management & Conclusion ⚠️
Key Risk Events: European economic data (German Industrial Production, ZEW Survey) and ECB commentary are key drivers. 🔥 As a major export index, the DAX is also highly sensitive to global growth expectations and geopolitical developments.
Position Sizing: Due to the potential for increased volatility at key levels, always use conservative position sizing. Risk no more than 1-2% of your capital on a single trade.
Conclusion: The GER40 is bullish but testing a major ceiling. ⚖️ The trend is your friend, but the smart play here is patience. Swing traders should wait for a pullback to strong support before entering. Intraday traders can play the range between 23,500 and 23,700 until a decisive break occurs. The most probable outcome is a period of consolidation or a shallow pullback before the next major directional move. 📊
Overall Bias: 🟢 Bullish above 23,200 | 🟡 Neutral/Bearish between 23,650-23,700
For individuals seeking to enhance their trading abilities based on the analyses provided, I recommend exploring the mentoring program offered by Shunya Trade. (Website: shunya dot trade)
I would appreciate your feedback on this analysis, as it will serve as a valuable resource for future endeavors.
Sincerely,
Shunya.Trade
Website: shunya dot trade
⚠️Disclaimer: This post is intended solely for educational purposes and does not constitute investment advice, financial advice, or trading recommendations. The views expressed herein are derived from technical analysis and are shared for informational purposes only. The stock market inherently carries risks, including the potential for capital loss. Therefore, readers are strongly advised to exercise prudent judgment before making any investment decisions. We assume no liability for any actions taken based on this content. For personalized guidance, it is recommended to consult a certified financial advisor.
I am nothing @shunya.trade
คำจำกัดสิทธิ์ความรับผิดชอบ
ข้อมูลและบทความไม่ได้มีวัตถุประสงค์เพื่อก่อให้เกิดกิจกรรมทางการเงิน, การลงทุน, การซื้อขาย, ข้อเสนอแนะ หรือคำแนะนำประเภทอื่น ๆ ที่ให้หรือรับรองโดย TradingView อ่านเพิ่มเติมใน ข้อกำหนดการใช้งาน
I am nothing @shunya.trade
คำจำกัดสิทธิ์ความรับผิดชอบ
ข้อมูลและบทความไม่ได้มีวัตถุประสงค์เพื่อก่อให้เกิดกิจกรรมทางการเงิน, การลงทุน, การซื้อขาย, ข้อเสนอแนะ หรือคำแนะนำประเภทอื่น ๆ ที่ให้หรือรับรองโดย TradingView อ่านเพิ่มเติมใน ข้อกำหนดการใช้งาน