"Price Action Alert: GBPCAD Testing Strong Demand Zone"
Technical Analysis of GBPCAD
1. Current Market Position
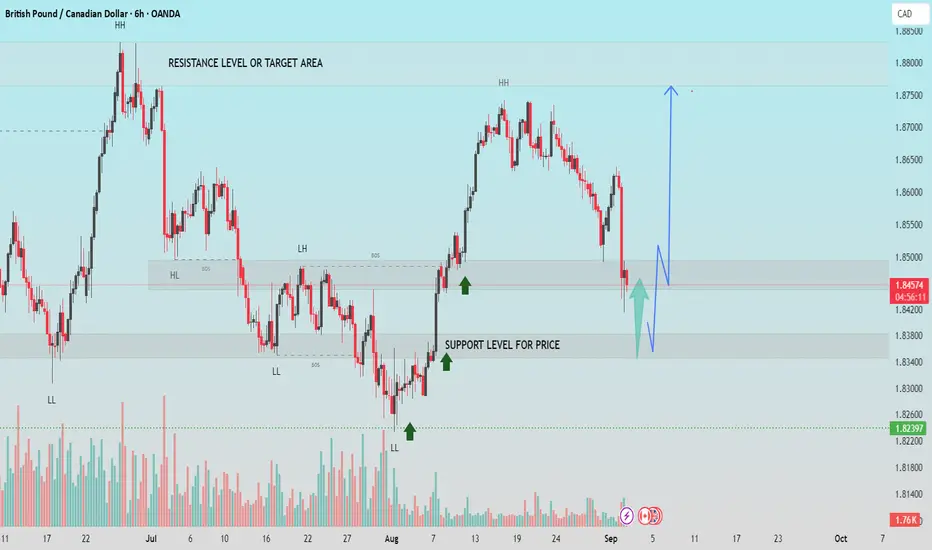
GBPCAD is trading around 1.8450, after a recent decline from the previous highs. The price is approaching a strong support zone near 1.8400 – 1.8360, which has previously acted as a demand area where buyers stepped in.
2. Key Support Zone
The 1.8400 – 1.8360 range is crucial because:
* It has historically triggered bullish reversals.
* The presence of higher liquidity suggests potential buying interest.
If the price respects this level, we could see a strong bullish push from this zone.
3. Resistance Levels
On the upside, the next major resistance or target zone is around 1.8650 – 1.8750. This level has previously acted as a supply area where sellers entered the market. A clean break above 1.8500 will increase bullish momentum toward this zone.
4. Potential Bullish Scenario
If the price holds the support zone and forms a bullish reversal pattern, we expect:
* First Target: 1.8550
* Second Target: 1.8650 – 1.8750
This scenario aligns with the overall market structure if buyers regain control.
5. Bearish Risk
If the price breaks below 1.8360, sellers could gain control, leading to a move toward the next key support at 1.8230.
6. Market Sentiment
Currently, the sentiment leans neutral to bullish, provided the price stays above the support zone.
If this helpful for you, press the like button.
1. Current Market Position
GBPCAD is trading around 1.8450, after a recent decline from the previous highs. The price is approaching a strong support zone near 1.8400 – 1.8360, which has previously acted as a demand area where buyers stepped in.
2. Key Support Zone
The 1.8400 – 1.8360 range is crucial because:
* It has historically triggered bullish reversals.
* The presence of higher liquidity suggests potential buying interest.
If the price respects this level, we could see a strong bullish push from this zone.
3. Resistance Levels
On the upside, the next major resistance or target zone is around 1.8650 – 1.8750. This level has previously acted as a supply area where sellers entered the market. A clean break above 1.8500 will increase bullish momentum toward this zone.
4. Potential Bullish Scenario
If the price holds the support zone and forms a bullish reversal pattern, we expect:
* First Target: 1.8550
* Second Target: 1.8650 – 1.8750
This scenario aligns with the overall market structure if buyers regain control.
5. Bearish Risk
If the price breaks below 1.8360, sellers could gain control, leading to a move toward the next key support at 1.8230.
6. Market Sentiment
Currently, the sentiment leans neutral to bullish, provided the price stays above the support zone.
If this helpful for you, press the like button.
การซื้อขายยังคงดำเนินอยู่
ปิดการเทรด: ถึงเป้าหมายการทำกำไร
💸FREE FOREX Signals in Telegram : t.me/FxInsightsHub0
🔹Join Our Telegram Channel, Pure Price Action Based Signals With Chart Analysis.
t.me/FxInsightsHub0
🚀FREE CRYPTO Signals In Telegram: t.me/FxInsightsHub0
🔹Join Our Telegram Channel, Pure Price Action Based Signals With Chart Analysis.
t.me/FxInsightsHub0
🚀FREE CRYPTO Signals In Telegram: t.me/FxInsightsHub0
การนำเสนอที่เกี่ยวข้อง
คำจำกัดสิทธิ์ความรับผิดชอบ
ข้อมูลและบทความไม่ได้มีวัตถุประสงค์เพื่อก่อให้เกิดกิจกรรมทางการเงิน, การลงทุน, การซื้อขาย, ข้อเสนอแนะ หรือคำแนะนำประเภทอื่น ๆ ที่ให้หรือรับรองโดย TradingView อ่านเพิ่มเติมที่ ข้อกำหนดการใช้งาน