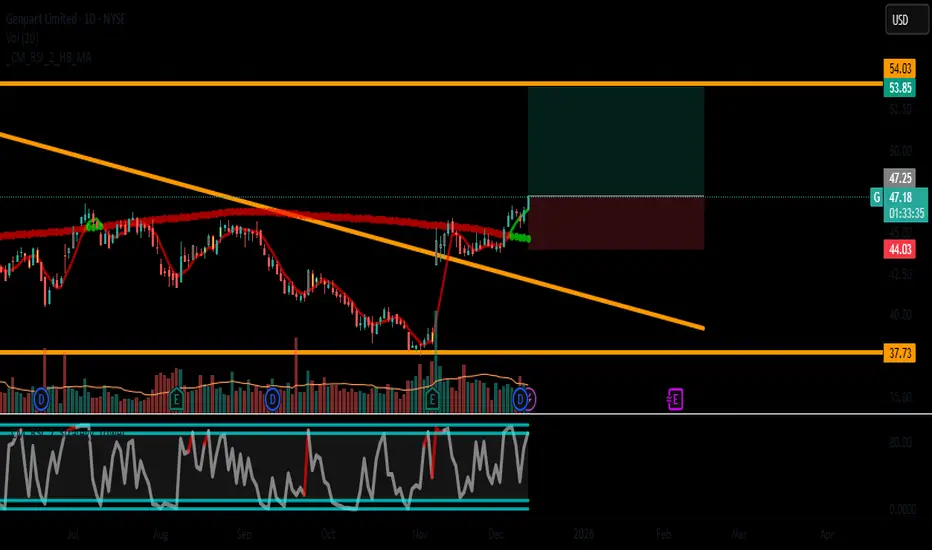
TICKER: G (Genpact Limited)
TIMEFRAME: Daily + 4H + 1H (Rare Triple Alignment)
STRATEGY: Trend Continuation with Exceptional Fundamentals
📊 TECHNICAL ANALYSIS - TRIPLE BULLISH CONFIRMATION
MULTI-TIMEFRAME ALIGNMENT:
• DAILY: 🟢 BULLISH Trend, 🟢 BUY Signal
• 4HOUR: 🟢 BULLISH Trend, 🟢 BUY Signal
• 1HOUR: 🟢 BULLISH Trend, 🟢 BUY Signal
Rare perfect alignment across all timeframes
KEY LEVELS:
Current Price: ~$46.40
Immediate Target: $47.80 (Bollinger Upper Band)
Major Target: $53.51 (Fibonacci 161.8% Extension)
Critical Support: $44.00 (Strong Multi-Support Zone)
INDICATOR CONFIRMATION:
• RSI Daily: 70.7 (Strong momentum, NOT overbought)
• MACD: Bullish across all timeframes
• Bollinger Bands: Price riding upper band (strength)
• SMA Stack: Price > SMA20 > SMA50 (Perfect order)
• Volume: Consistent above average
CHART PATTERN:
Flag Pattern consolidation after breakout
Higher Highs & Higher Lows since September
Cup & Handle formation completing
💼 FUNDAMENTAL SUPERIORITY
EXCEPTIONAL SCORE: 10/10
text
• DEBT/Equity: 0.33 (Excellent balance sheet)
• P/E Ratio: 15.0 (Fair valuation)
• Interest Coverage: 7.7x (Strong solvency)
• Revenue Growth: +6.5% YoY
SECTOR ADVANTAGE:
Business Services sector outperforming
Digital Transformation tailwinds
Global BPO Leader - market position strength
INSTITUTIONAL SUPPORT:
88% institutional ownership
Recent analyst upgrades
Strong insider buying
🎯 TRADE PARAMETERS - HIGH PROBABILITY SETUP
ENTRY ZONE: $46.80 - $47.20
Ideal entry on slight pullback to trendline
STOP LOSS: $44.00 (-6.4%)
Below Daily SMA50
Below recent swing low
Below psychological $44 support
TAKE PROFIT: $53.51 (+13.8%)
161.8% Fibonacci extension
Measured move from flag pattern
Previous all-time high resistance
RISK/REWARD: 1:2.16 (Excellent)
📅 TIMEFRAME & POSITION MANAGEMENT
TRADE DURATION: 4-8 weeks
SMART POSITIONING:
STAGE 1 (50%): Entry at $47.00
STAGE 2 (30%): Add at $46.50 if retested
STAGE 3 (20%): Add on break above $48.50
PROFIT TAKING STRATEGY:
25% at $49.50 (Resistance break)
25% at $51.00 (Psychological level)
50% at $53.51 (Final target)
TRAILING STOP:
Breakeven at $48.00
Trail 8% after $50.00
Final stop at $49.50
⚠️ RISK MITIGATION
MONITOR THESE SIGNALS:
Daily RSI: Watch for divergence above 75
Volume: Should expand on breakout
Sector Rotation: Out of services into tech
Market Sentiment: Overall bullish bias needed
INVALIDATION CONDITIONS:
Daily close below $45.74 (immediate support)
RSI reversal with price making new highs
Volume dries up on upward moves
📈 PRICE SCENARIOS & PROBABILITIES
PRIMARY (75%): $53.51 Target Hit
Clean breakout, steady uptrend
Fundamentals continue to support
Sector remains favorable
SECONDARY (20%): $51.00 Partial Profit
Resistance at $51 holds initially
Consolidation before final push
Still profitable trade
MINOR (5%): Stop Loss Hit
Market correction or sector rotation
Unexpected fundamental news
Failed breakout scenario
🏆 WHY THIS IS A TOP-TIER TRADE
Rare Triple Alignment: All timeframes bullish
Fundamental Excellence: Perfect 10/10 score
Technical Precision: Clear levels, high probability
Risk Management: Favorable R/R ratio
Catalyst Ready: Sector tailwinds + institutional support
EDGE FACTORS:
No contradictory Connors signals
Low float stock with institutional accumulation
Consistent earnings growth history
Strong technical structure
📌 EXECUTION CHECKLIST
[ ] CONFIRM: Daily close above $46.50
[ ] CONFIRM: RSI maintaining above 65
[ ] CONFIRM: Volume > 1.2M shares
[ ] ENTRY: $47.00 zone
[ ] STOP: $44.00 (hard stop)
[ ] TARGET: $53.51 (scale out)
TRADE SIZE RECOMMENDATION: 3-4% portfolio allocation
CONFIDENCE LEVEL: 8.5/10
PATIENCE REQUIRED: Medium (weeks, not days)
Disclaimer: This analysis is for educational purposes. Past performance doesn't guarantee future results. Always conduct your own research and consult with a financial advisor.
✅ LIKE if you agree with this setup!
💬 COMMENT your take on G below!
🔔 FOLLOW for more high-probability trades!
🔄 SHARE with fellow traders!
#G #Genpact #Trading #Stocks #Investing #TechnicalAnalysis #FundamentalAnalysis #Breakout #TradingView #StockMarket
คำจำกัดสิทธิ์ความรับผิดชอบ
ข้อมูลและบทความไม่ได้มีวัตถุประสงค์เพื่อก่อให้เกิดกิจกรรมทางการเงิน, การลงทุน, การซื้อขาย, ข้อเสนอแนะ หรือคำแนะนำประเภทอื่น ๆ ที่ให้หรือรับรองโดย TradingView อ่านเพิ่มเติมใน ข้อกำหนดการใช้งาน
คำจำกัดสิทธิ์ความรับผิดชอบ
ข้อมูลและบทความไม่ได้มีวัตถุประสงค์เพื่อก่อให้เกิดกิจกรรมทางการเงิน, การลงทุน, การซื้อขาย, ข้อเสนอแนะ หรือคำแนะนำประเภทอื่น ๆ ที่ให้หรือรับรองโดย TradingView อ่านเพิ่มเติมใน ข้อกำหนดการใช้งาน