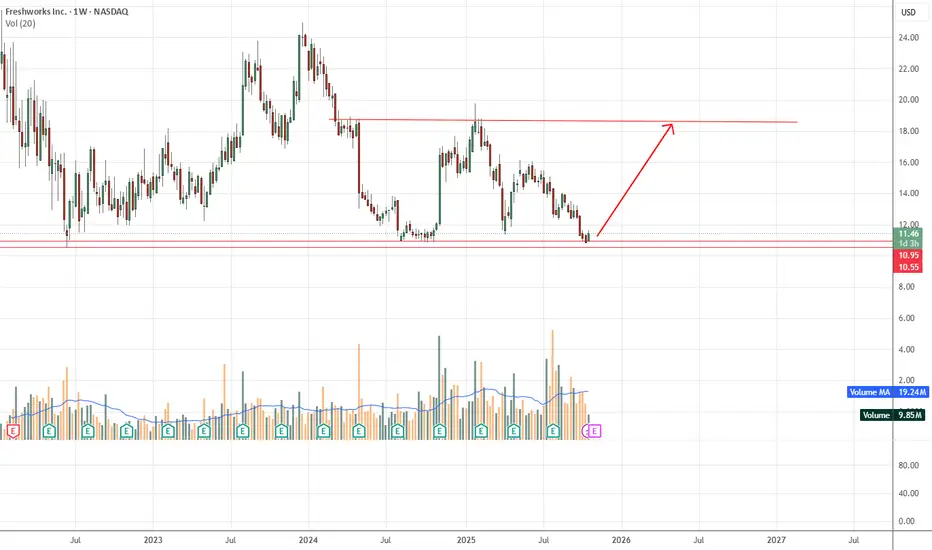
The stock is currently trading around $11.44, near its recent support zone at roughly $10.55–$10.95.
The chart shows a downtrend from previous highs, but price is testing a historically strong support level.
Resistance: Around $18 (where the upward arrow points), representing prior swing highs.
Bullish setup at current levels with clear risk/reward: low risk near support, high reward toward prior resistance.
Traders may look for confirmation (bullish candlestick, volume increase) before entering.
การซื้อขายยังคงดำเนินอยู่
คำจำกัดสิทธิ์ความรับผิดชอบ
ข้อมูลและบทความไม่ได้มีวัตถุประสงค์เพื่อก่อให้เกิดกิจกรรมทางการเงิน, การลงทุน, การซื้อขาย, ข้อเสนอแนะ หรือคำแนะนำประเภทอื่น ๆ ที่ให้หรือรับรองโดย TradingView อ่านเพิ่มเติมใน ข้อกำหนดการใช้งาน
คำจำกัดสิทธิ์ความรับผิดชอบ
ข้อมูลและบทความไม่ได้มีวัตถุประสงค์เพื่อก่อให้เกิดกิจกรรมทางการเงิน, การลงทุน, การซื้อขาย, ข้อเสนอแนะ หรือคำแนะนำประเภทอื่น ๆ ที่ให้หรือรับรองโดย TradingView อ่านเพิ่มเติมใน ข้อกำหนดการใช้งาน