Technical Snapshot:
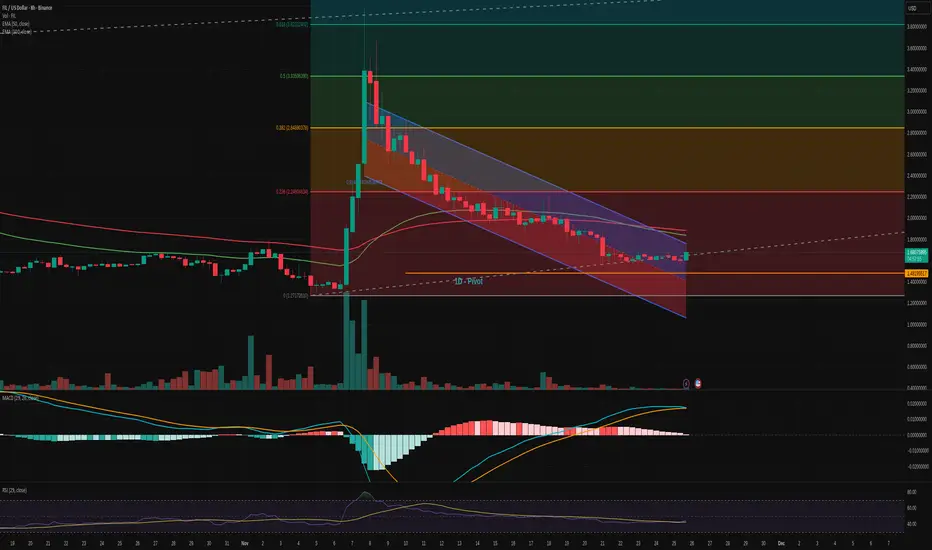
Price has broken out of a well-defined descending channel, indicating a potential shift in market structure.
Momentum indicators such as the MACD are showing early bullish crossover signals. Histogram is transitioning into positive territory, suggesting strength.
RSI (29) is recovering from a prolonged oversold phase, currently stabilizing around 45. This signals a potential momentum buildup.
Key Technical Levels:
Immediate resistance stands at the 0.236 Fibonacci retracement level around $2.25.
A successful close above this level may open the path toward the 0.382 ($2.84), 0.5 ($3.33), and 0.618 ($3.82) retracement zones.
Local support has held firm at $1.48 – a key structural level that has shown strong buying interest.
EMA Structure:
The price is currently attempting to reclaim the 50 EMA, with the 100 EMA above acting as dynamic resistance.
A clean flip of both EMAs would likely confirm bullish continuation on the mid-term.
Volume and Pivot Analysis:
Breakout volume is increasing after a period of low-volume consolidation, typically a precursor to trend acceleration.
Daily pivot levels are acting as a baseline. A reclaim and hold above the pivot supports the bullish thesis.
Conclusion:
FIL has shown a strong technical breakout from a descending structure. If the breakout sustains and key resistance levels are reclaimed, there is substantial upside potential toward higher Fibonacci retracement levels. The price action must now confirm with a follow-through above the $1.85–$2.25 region. Downside risk remains contained as long as $1.6 holds as support.
คำจำกัดสิทธิ์ความรับผิดชอบ
ข้อมูลและบทความไม่ได้มีวัตถุประสงค์เพื่อก่อให้เกิดกิจกรรมทางการเงิน, การลงทุน, การซื้อขาย, ข้อเสนอแนะ หรือคำแนะนำประเภทอื่น ๆ ที่ให้หรือรับรองโดย TradingView อ่านเพิ่มเติมใน ข้อกำหนดการใช้งาน
คำจำกัดสิทธิ์ความรับผิดชอบ
ข้อมูลและบทความไม่ได้มีวัตถุประสงค์เพื่อก่อให้เกิดกิจกรรมทางการเงิน, การลงทุน, การซื้อขาย, ข้อเสนอแนะ หรือคำแนะนำประเภทอื่น ๆ ที่ให้หรือรับรองโดย TradingView อ่านเพิ่มเติมใน ข้อกำหนดการใช้งาน