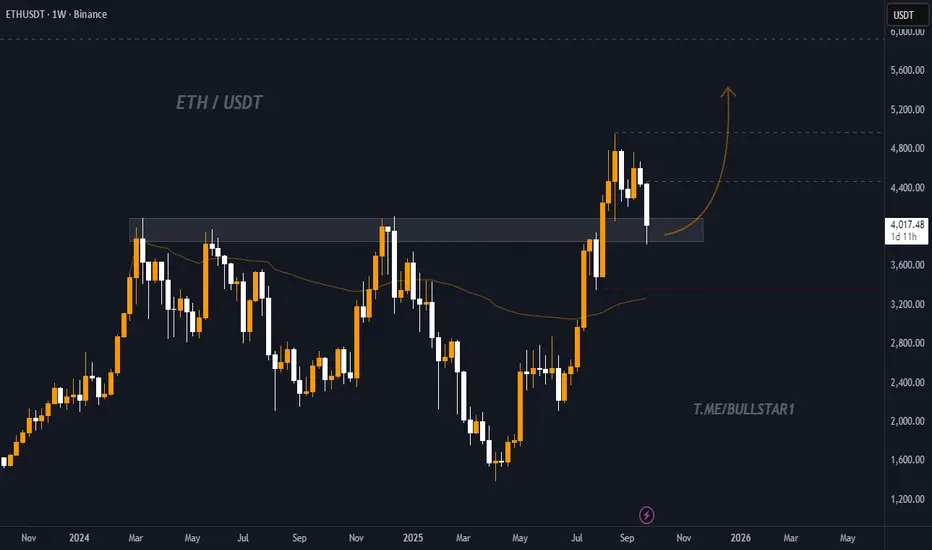
Ethereum (ETH) on the 1W chart has pulled back to a key resistance-turned-support zone around 3,800 – 4,000 USDT. This level also aligns with the 50-week moving average, creating a strong liquidity and demand area.
After a sharp rally towards 4,800 USDT, the price is currently correcting and consolidating above support. As long as this zone holds, a bullish continuation towards higher targets is expected.
🔑 Key Idea
As long as ETH holds above the 3,800 – 4,000 USDT zone, upside momentum remains valid.
A breakdown below this level would invalidate the mid-term bullish scenario.
📈 Targets:
Target 1: 4,400 USDT
Target 2: 4,800 USDT
Target 3: 5,200 USDT
⛔ Stop Loss:
Below 3,600 USDT to limit downside risk if support fails.
คำจำกัดสิทธิ์ความรับผิดชอบ
ข้อมูลและบทความไม่ได้มีวัตถุประสงค์เพื่อก่อให้เกิดกิจกรรมทางการเงิน, การลงทุน, การซื้อขาย, ข้อเสนอแนะ หรือคำแนะนำประเภทอื่น ๆ ที่ให้หรือรับรองโดย TradingView อ่านเพิ่มเติมที่ ข้อกำหนดการใช้งาน
คำจำกัดสิทธิ์ความรับผิดชอบ
ข้อมูลและบทความไม่ได้มีวัตถุประสงค์เพื่อก่อให้เกิดกิจกรรมทางการเงิน, การลงทุน, การซื้อขาย, ข้อเสนอแนะ หรือคำแนะนำประเภทอื่น ๆ ที่ให้หรือรับรองโดย TradingView อ่านเพิ่มเติมที่ ข้อกำหนดการใช้งาน