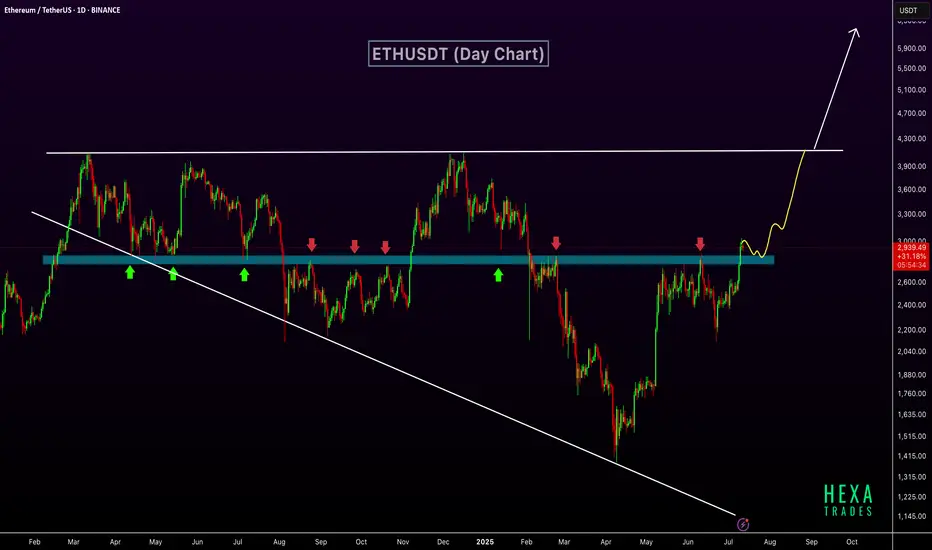
ETHUSDT has broken out above a key horizontal resistance zone that has historically acted as a strong support and resistance level. This zone, marked in blue, has seen multiple rejections and bounces over the past year, confirming its significance.
The recent breakout above this zone indicates a shift in market structure and suggests growing bullish momentum. The price action shows a clean move above resistance, with potential for a retest before continuing higher. The market is also forming a long-term broadening wedge pattern. The next target lies near the upper resistance of the wedge, around $4,000. If the price breaks above this broadening wedge, it could open the path toward the $6,000 level.
Regards
Hexa
🚀Telegram : t.me/hexatrades
🌐Website: hexatrades.io/
🗣️Twitter(X): twitter.com/HexaTrades
🌐Website: hexatrades.io/
🗣️Twitter(X): twitter.com/HexaTrades
การนำเสนอที่เกี่ยวข้อง
คำจำกัดสิทธิ์ความรับผิดชอบ
ข้อมูลและบทความไม่ได้มีวัตถุประสงค์เพื่อก่อให้เกิดกิจกรรมทางการเงิน, การลงทุน, การซื้อขาย, ข้อเสนอแนะ หรือคำแนะนำประเภทอื่น ๆ ที่ให้หรือรับรองโดย TradingView อ่านเพิ่มเติมใน ข้อกำหนดการใช้งาน