Ethereum (ETH/USDT)
Ethereum is moving at a similar pace to Bitcoin – showing heavy volatility and liquidation pressure, but there are also signs of accumulation near strong support.
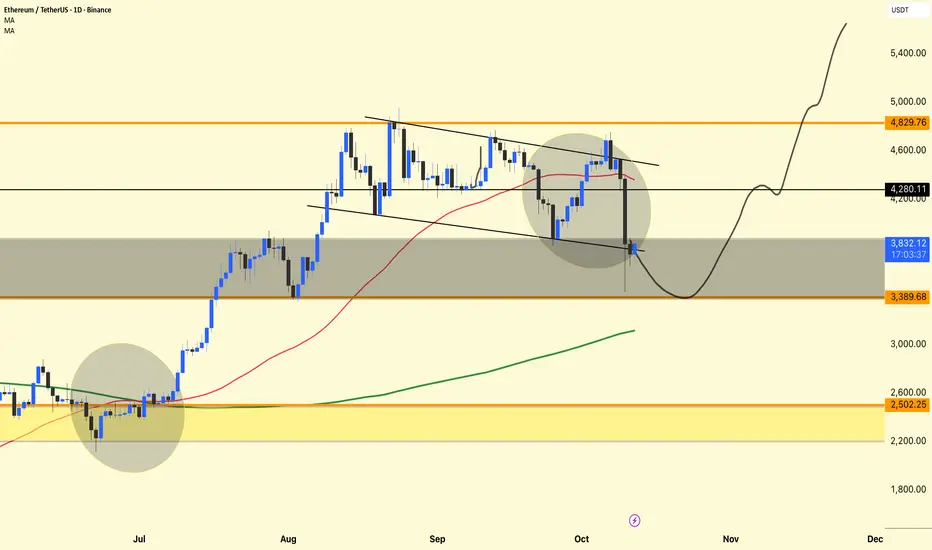
The chart shows a return to a key demand zone after a breakout failure from a descending wedge, followed by the formation of a potential reversal structure.
Descending Channel and Breakdown
ETH had been moving within a descending channel for several weeks.
Recently, it attempted a breakout, but sellers regained control, resulting in a false breakout and a retest rejection.
The candle's sharp decline through the red moving average (around $4,300) indicates that bulls were heavily liquidated.
However, the price saw buying interest around the $3,800–$3,400 area, which aligns with the chart's gray support area.
Moving Average Insights
Red MA (50-day): Currently acting as dynamic resistance; ETH needs a clear close above it to confirm a short-term bullish recovery.
Green MA (200-day): Still trending upwards, indicating that the long-term structure remains bullish despite near-term weakness.
If the price stabilizes above the 200-day MA, it will likely attract medium-term investors.
Current Price Activity
At $3,836, ETH is testing the lower boundary of the support zone.
The chart projection (curved black line) suggests:
A possible short-term retest towards $3,380,
Followed by a gradual recovery towards $4,200,
And then a potential continuation towards $4,800+ if momentum strengthens.
This pattern resembles a "spring" setup—a common accumulation behavior before a major reversal.
DYOR | NFA
Ethereum is moving at a similar pace to Bitcoin – showing heavy volatility and liquidation pressure, but there are also signs of accumulation near strong support.
The chart shows a return to a key demand zone after a breakout failure from a descending wedge, followed by the formation of a potential reversal structure.
Descending Channel and Breakdown
ETH had been moving within a descending channel for several weeks.
Recently, it attempted a breakout, but sellers regained control, resulting in a false breakout and a retest rejection.
The candle's sharp decline through the red moving average (around $4,300) indicates that bulls were heavily liquidated.
However, the price saw buying interest around the $3,800–$3,400 area, which aligns with the chart's gray support area.
Moving Average Insights
Red MA (50-day): Currently acting as dynamic resistance; ETH needs a clear close above it to confirm a short-term bullish recovery.
Green MA (200-day): Still trending upwards, indicating that the long-term structure remains bullish despite near-term weakness.
If the price stabilizes above the 200-day MA, it will likely attract medium-term investors.
Current Price Activity
At $3,836, ETH is testing the lower boundary of the support zone.
The chart projection (curved black line) suggests:
A possible short-term retest towards $3,380,
Followed by a gradual recovery towards $4,200,
And then a potential continuation towards $4,800+ if momentum strengthens.
This pattern resembles a "spring" setup—a common accumulation behavior before a major reversal.
DYOR | NFA
การนำเสนอที่เกี่ยวข้อง
คำจำกัดสิทธิ์ความรับผิดชอบ
ข้อมูลและบทความไม่ได้มีวัตถุประสงค์เพื่อก่อให้เกิดกิจกรรมทางการเงิน, การลงทุน, การซื้อขาย, ข้อเสนอแนะ หรือคำแนะนำประเภทอื่น ๆ ที่ให้หรือรับรองโดย TradingView อ่านเพิ่มเติมที่ ข้อกำหนดการใช้งาน
การนำเสนอที่เกี่ยวข้อง
คำจำกัดสิทธิ์ความรับผิดชอบ
ข้อมูลและบทความไม่ได้มีวัตถุประสงค์เพื่อก่อให้เกิดกิจกรรมทางการเงิน, การลงทุน, การซื้อขาย, ข้อเสนอแนะ หรือคำแนะนำประเภทอื่น ๆ ที่ให้หรือรับรองโดย TradingView อ่านเพิ่มเติมที่ ข้อกำหนดการใช้งาน