History Doesn’t Repeat, But It Often Rhymes – ETH = BTC 2020?
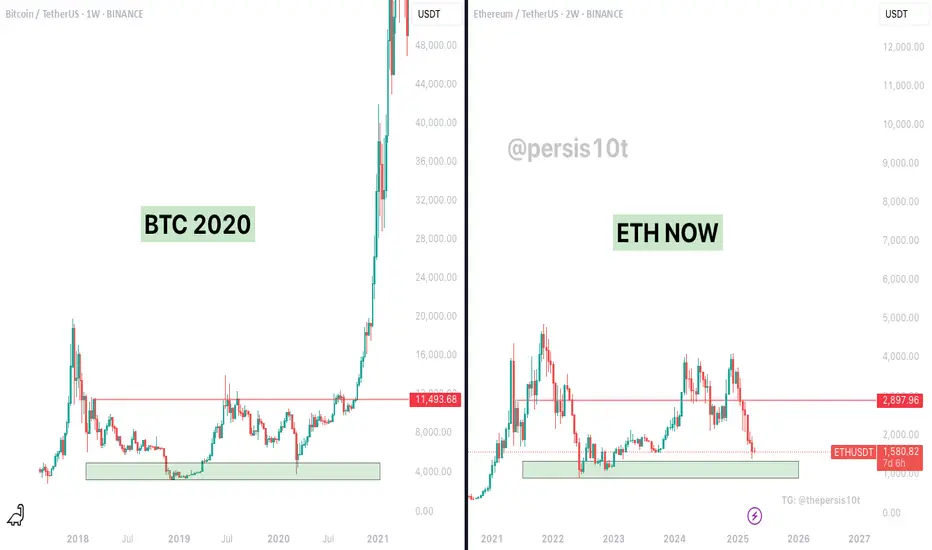
On the left: BTC in 2020 before it exploded from ~$11K to $ 60 K+
On the right: ETH now, sitting on a similar macro support zone and showing a similar multi-year accumulation range.
This Chart Suggests:
BTC (2020) consolidated for years in a tight range between $3K and $ 12K before blasting off.
ETH has now spent over two years ranging between ~ $ 1K and $3K, forming a strong base at support just like BTC did.
The current ETH structure mirrors BTC's pre-bull breakout — clean support retest, fakeouts, and suppressed volatility.
If ETH follows a similar path, the next parabolic expansion could be approaching.
This isn't just about pattern recognition — it's about timing cycles, sentiment shifts, and institutional patience.
“The best trades often feel the most uncomfortable.”
While many are panicking, ETH is printing a macro setup that resembles the beginning of Bitcoin’s strongest run in history.
Are you prepared if ETH goes full BTC 2020 mode?
การซื้อขายยังคงดำเนินอยู่
คำจำกัดสิทธิ์ความรับผิดชอบ
ข้อมูลและบทความไม่ได้มีวัตถุประสงค์เพื่อก่อให้เกิดกิจกรรมทางการเงิน, การลงทุน, การซื้อขาย, ข้อเสนอแนะ หรือคำแนะนำประเภทอื่น ๆ ที่ให้หรือรับรองโดย TradingView อ่านเพิ่มเติมที่ ข้อกำหนดการใช้งาน
คำจำกัดสิทธิ์ความรับผิดชอบ
ข้อมูลและบทความไม่ได้มีวัตถุประสงค์เพื่อก่อให้เกิดกิจกรรมทางการเงิน, การลงทุน, การซื้อขาย, ข้อเสนอแนะ หรือคำแนะนำประเภทอื่น ๆ ที่ให้หรือรับรองโดย TradingView อ่านเพิ่มเติมที่ ข้อกำหนดการใช้งาน