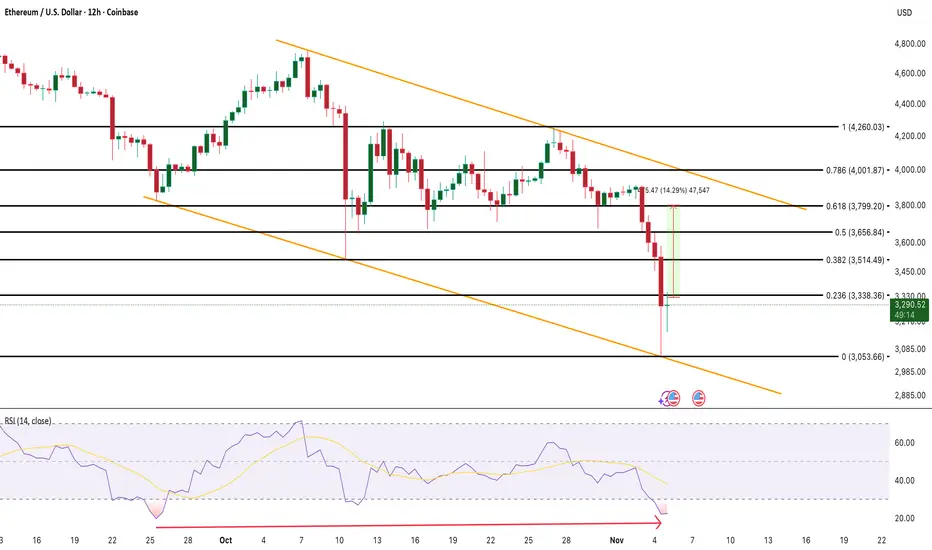
The RSI shows a clear bullish divergence, where price made lower lows but RSI formed higher lows between September 25 and November 4. This pattern often signals fading bearish momentum and a potential reversal.
From a derivatives view, nearly $1.2 billion in short positions are clustered between $3,320 and $3,740, compared to just $330 million in long exposure. A move above $3,338 could trigger short covering, accelerating price gains. On-chain data adds mild support: large holders have modestly increased their positions, and the NUPL ratio near 0.27 shows most weak hands have already exited.
A daily close below $3,053 would invalidate the rebound case, but holding above it keeps
Leader in crypto news, award winning journalism in 26 languages.
คำจำกัดสิทธิ์ความรับผิดชอบ
ข้อมูลและบทความไม่ได้มีวัตถุประสงค์เพื่อก่อให้เกิดกิจกรรมทางการเงิน, การลงทุน, การซื้อขาย, ข้อเสนอแนะ หรือคำแนะนำประเภทอื่น ๆ ที่ให้หรือรับรองโดย TradingView อ่านเพิ่มเติมใน ข้อกำหนดการใช้งาน
Leader in crypto news, award winning journalism in 26 languages.
คำจำกัดสิทธิ์ความรับผิดชอบ
ข้อมูลและบทความไม่ได้มีวัตถุประสงค์เพื่อก่อให้เกิดกิจกรรมทางการเงิน, การลงทุน, การซื้อขาย, ข้อเสนอแนะ หรือคำแนะนำประเภทอื่น ๆ ที่ให้หรือรับรองโดย TradingView อ่านเพิ่มเติมใน ข้อกำหนดการใช้งาน