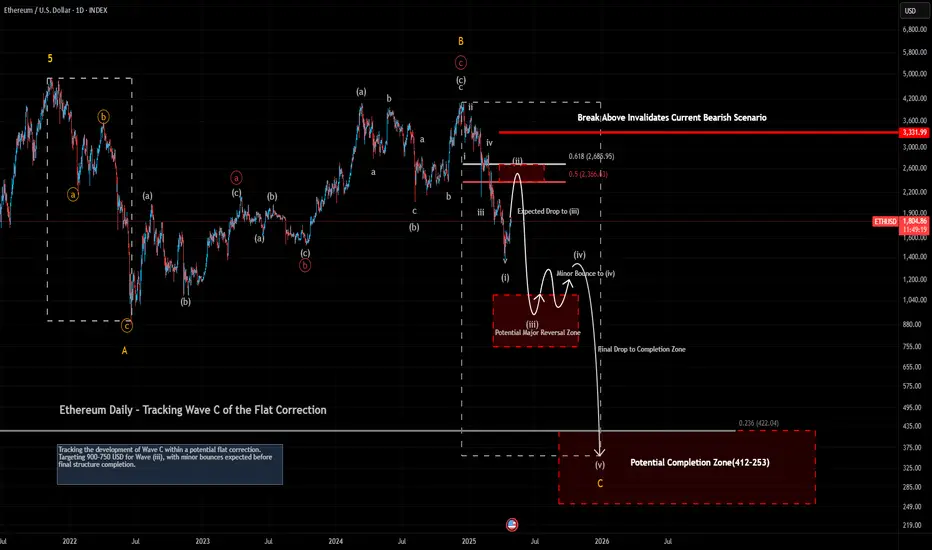
On the daily timeframe, Ethereum is unfolding within the early stages of Wave C, following the completion of a flat correction pattern.
The price has completed Wave (i) and appears to be in a corrective Wave (ii) targeting the 0.5–0.618 retracement zones (around $2366 to $2485).
Upon completion of Wave (ii), a sharp Wave (iii) decline towards the 1085–754 zone is expected.
📈 For a bigger picture, please refer to my Weekly and Monthly Ethereum analyses.
#Ethereum #ETH #DailyChart #CryptoAnalysis #TechnicalAnalysis #ElliottWave #CryptoTrading
คำจำกัดสิทธิ์ความรับผิดชอบ
ข้อมูลและบทความไม่ได้มีวัตถุประสงค์เพื่อก่อให้เกิดกิจกรรมทางการเงิน, การลงทุน, การซื้อขาย, ข้อเสนอแนะ หรือคำแนะนำประเภทอื่น ๆ ที่ให้หรือรับรองโดย TradingView อ่านเพิ่มเติมใน ข้อกำหนดการใช้งาน
คำจำกัดสิทธิ์ความรับผิดชอบ
ข้อมูลและบทความไม่ได้มีวัตถุประสงค์เพื่อก่อให้เกิดกิจกรรมทางการเงิน, การลงทุน, การซื้อขาย, ข้อเสนอแนะ หรือคำแนะนำประเภทอื่น ๆ ที่ให้หรือรับรองโดย TradingView อ่านเพิ่มเติมใน ข้อกำหนดการใช้งาน