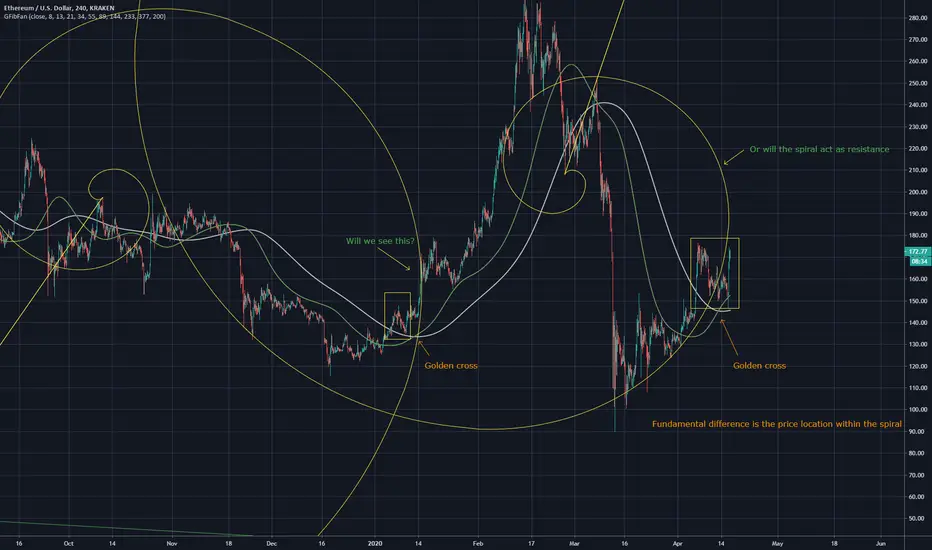
Comparison of two similar points on Ethereum
The previous golden cross produced a run that was on the INSIDE of the fibonacci spiral
While this golden cross is on the outside of the fib spiral, will this repeat? Or will it act as a resistance

Here is my bottoms chart for Ethereum showing bottom points and potential future bottoms
The previous golden cross produced a run that was on the INSIDE of the fibonacci spiral
While this golden cross is on the outside of the fib spiral, will this repeat? Or will it act as a resistance
Here is my bottoms chart for Ethereum showing bottom points and potential future bottoms
คำจำกัดสิทธิ์ความรับผิดชอบ
ข้อมูลและบทความไม่ได้มีวัตถุประสงค์เพื่อก่อให้เกิดกิจกรรมทางการเงิน, การลงทุน, การซื้อขาย, ข้อเสนอแนะ หรือคำแนะนำประเภทอื่น ๆ ที่ให้หรือรับรองโดย TradingView อ่านเพิ่มเติมที่ ข้อกำหนดการใช้งาน
คำจำกัดสิทธิ์ความรับผิดชอบ
ข้อมูลและบทความไม่ได้มีวัตถุประสงค์เพื่อก่อให้เกิดกิจกรรมทางการเงิน, การลงทุน, การซื้อขาย, ข้อเสนอแนะ หรือคำแนะนำประเภทอื่น ๆ ที่ให้หรือรับรองโดย TradingView อ่านเพิ่มเติมที่ ข้อกำหนดการใช้งาน