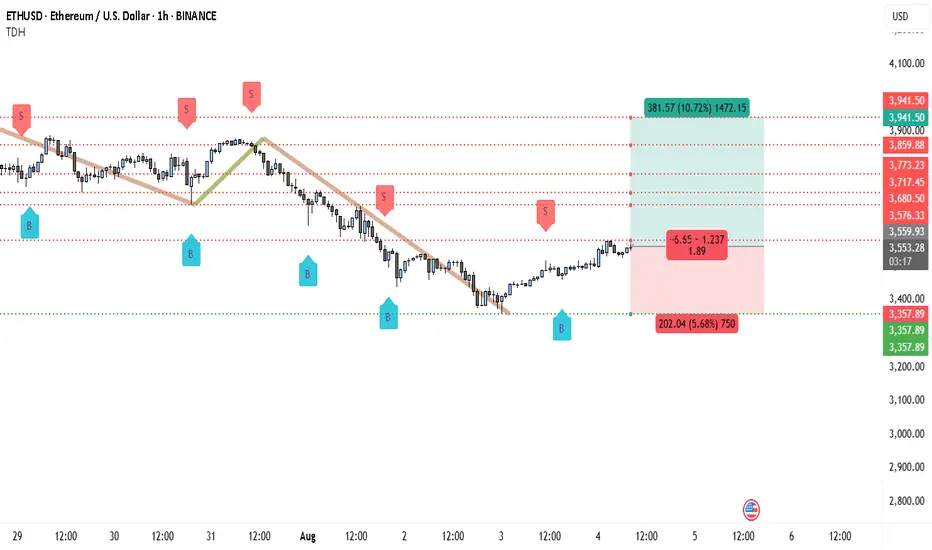
Ethereum has recently broken above a short-term descending trendline that had been guiding the market lower over the past sessions. This breakout occurred after price formed a strong base around the $3,357 support zone, indicating that sellers were losing momentum. The “B” buy signals printed near these lows further strengthen the bullish outlook.
The immediate resistance lies around $3,559, which is the level price is currently approaching. If buyers can maintain momentum above this area, the next upside targets are $3,576, $3,680, $3,717, and $3,773. The major resistance and projected take-profit area is near $3,941.
From a structural standpoint, the shift from lower lows to higher lows suggests that the short-term trend may be reversing in favor of buyers. This aligns with the increased buying volume observed after the breakout, hinting at potential follow-through in the next London or New York session.
Trading Setup
• Entry: Around $3,553 after breakout confirmation
• Stop-loss: Below $3,357
• Take-profit 1: $3,680
• Take-profit 2: $3,773
• Final Target: $3,941
• Risk-Reward: Approximately 1.89:1
บันทึก
Hurraahhhhh! Hit all TPsTrade forex, indices, stocks and metals with up to US$100.000 in company's funding.
Complete a challenge to access funding or go for instant deposit.
Trading involves substantial risk. Not financial advice
Complete a challenge to access funding or go for instant deposit.
Trading involves substantial risk. Not financial advice
การนำเสนอที่เกี่ยวข้อง
คำจำกัดสิทธิ์ความรับผิดชอบ
ข้อมูลและบทความไม่ได้มีวัตถุประสงค์เพื่อก่อให้เกิดกิจกรรมทางการเงิน, การลงทุน, การซื้อขาย, ข้อเสนอแนะ หรือคำแนะนำประเภทอื่น ๆ ที่ให้หรือรับรองโดย TradingView อ่านเพิ่มเติมที่ ข้อกำหนดการใช้งาน
Trade forex, indices, stocks and metals with up to US$100.000 in company's funding.
Complete a challenge to access funding or go for instant deposit.
Trading involves substantial risk. Not financial advice
Complete a challenge to access funding or go for instant deposit.
Trading involves substantial risk. Not financial advice
การนำเสนอที่เกี่ยวข้อง
คำจำกัดสิทธิ์ความรับผิดชอบ
ข้อมูลและบทความไม่ได้มีวัตถุประสงค์เพื่อก่อให้เกิดกิจกรรมทางการเงิน, การลงทุน, การซื้อขาย, ข้อเสนอแนะ หรือคำแนะนำประเภทอื่น ๆ ที่ให้หรือรับรองโดย TradingView อ่านเพิ่มเติมที่ ข้อกำหนดการใช้งาน