🔎 Weekly Timeframe Levels & Technical Picture
1. Current Price Context
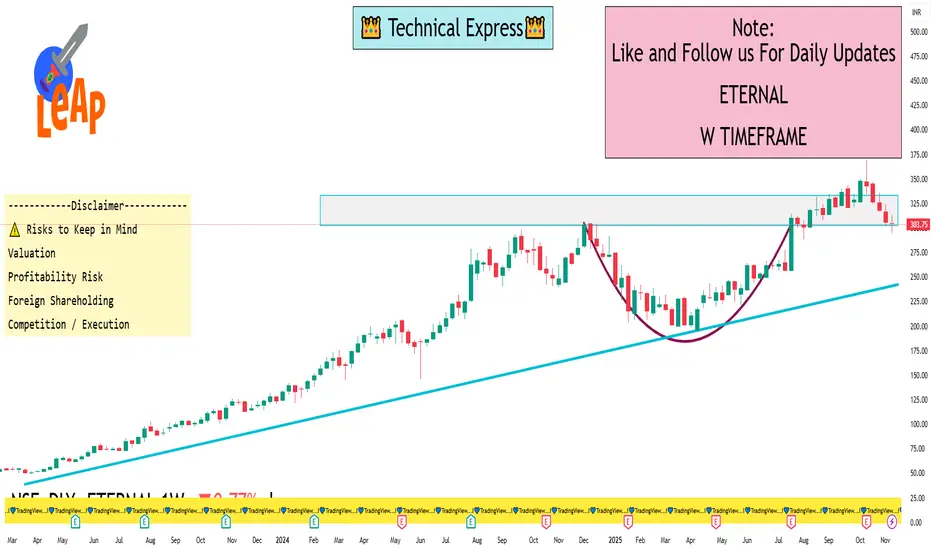
a) Eternal is trading around ~₹303–306.
b) On 5paisa, support levels: ~₹297.3 (S1), then ~₹290.8 (S2).
c) Their 200-day SMA (on weekly or daily) is around ~₹280.2 (etMoney data).
2. Trend Structure & Key Zones
a) Major Support Zone: ~₹290–300 — this is a psychologically important zone, and there’s technical support around here.
b) Resistance / Key Level: ~₹320 — based on multiple trader viewpoints, breaking decisively above 320 could change short-term bias.
c) According to etMoney, RSI on weekly is not overly strong; momentum is somewhat neutral-to-down.
3. Chart Patterns / Candlestick Signal
a) Some traders point to a bearish engulfing pattern on the weekly.
b) If the weekly closes below ~₹320 with this pattern, the bearish case gains strength (according to those traders).
c) On the flip side, if 320 holds and price bounces, we might see a retracement or consolidation rather than a full breakdown.
4. Valuation Risk / Fundamental Pressure
a) Eternal’s valuation is very rich: its P/E is extremely high, which concerns some market participants.
b) On the fundamental side: strong revenue growth is being driven by Blinkit (quick commerce), but profit pressures remain.
c) According to a report, losses might have peaked, but execution risk remains.
1. Current Price Context
a) Eternal is trading around ~₹303–306.
b) On 5paisa, support levels: ~₹297.3 (S1), then ~₹290.8 (S2).
c) Their 200-day SMA (on weekly or daily) is around ~₹280.2 (etMoney data).
2. Trend Structure & Key Zones
a) Major Support Zone: ~₹290–300 — this is a psychologically important zone, and there’s technical support around here.
b) Resistance / Key Level: ~₹320 — based on multiple trader viewpoints, breaking decisively above 320 could change short-term bias.
c) According to etMoney, RSI on weekly is not overly strong; momentum is somewhat neutral-to-down.
3. Chart Patterns / Candlestick Signal
a) Some traders point to a bearish engulfing pattern on the weekly.
b) If the weekly closes below ~₹320 with this pattern, the bearish case gains strength (according to those traders).
c) On the flip side, if 320 holds and price bounces, we might see a retracement or consolidation rather than a full breakdown.
4. Valuation Risk / Fundamental Pressure
a) Eternal’s valuation is very rich: its P/E is extremely high, which concerns some market participants.
b) On the fundamental side: strong revenue growth is being driven by Blinkit (quick commerce), but profit pressures remain.
c) According to a report, losses might have peaked, but execution risk remains.
I built a Buy & Sell Signal Indicator with 85% accuracy.
📈 Get access via DM or
WhatsApp: wa.link/d997q0
Contact - +91 76782 40962
| Email: techncialexpress@gmail.com
| Script Coder | Trader | Investor | From India
📈 Get access via DM or
WhatsApp: wa.link/d997q0
Contact - +91 76782 40962
| Email: techncialexpress@gmail.com
| Script Coder | Trader | Investor | From India
การนำเสนอที่เกี่ยวข้อง
คำจำกัดสิทธิ์ความรับผิดชอบ
ข้อมูลและบทความไม่ได้มีวัตถุประสงค์เพื่อก่อให้เกิดกิจกรรมทางการเงิน, การลงทุน, การซื้อขาย, ข้อเสนอแนะ หรือคำแนะนำประเภทอื่น ๆ ที่ให้หรือรับรองโดย TradingView อ่านเพิ่มเติมใน ข้อกำหนดการใช้งาน