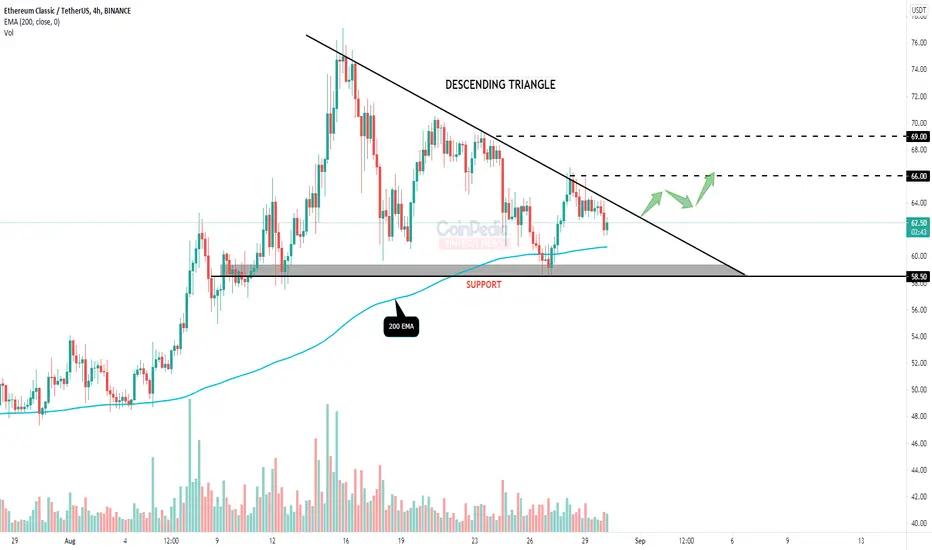
* Ethereum classic in 4H time frame forms a descending triangle with it's support near $58.5 and the above trend-line as it's resistance.
* The 200 EMA ( Exponential moving average ) is working as support for the price.
* If the price breaks the upper trend-line (resistance) we can expect a bullish move till $69.
* ETC is bearish below it's support zone.
* The 200 EMA ( Exponential moving average ) is working as support for the price.
* If the price breaks the upper trend-line (resistance) we can expect a bullish move till $69.
* ETC is bearish below it's support zone.
ปิดการเทรด: ถึงเป้าหมายการทำกำไร
คำจำกัดสิทธิ์ความรับผิดชอบ
ข้อมูลและบทความไม่ได้มีวัตถุประสงค์เพื่อก่อให้เกิดกิจกรรมทางการเงิน, การลงทุน, การซื้อขาย, ข้อเสนอแนะ หรือคำแนะนำประเภทอื่น ๆ ที่ให้หรือรับรองโดย TradingView อ่านเพิ่มเติมที่ ข้อกำหนดการใช้งาน
คำจำกัดสิทธิ์ความรับผิดชอบ
ข้อมูลและบทความไม่ได้มีวัตถุประสงค์เพื่อก่อให้เกิดกิจกรรมทางการเงิน, การลงทุน, การซื้อขาย, ข้อเสนอแนะ หรือคำแนะนำประเภทอื่น ๆ ที่ให้หรือรับรองโดย TradingView อ่านเพิ่มเติมที่ ข้อกำหนดการใช้งาน