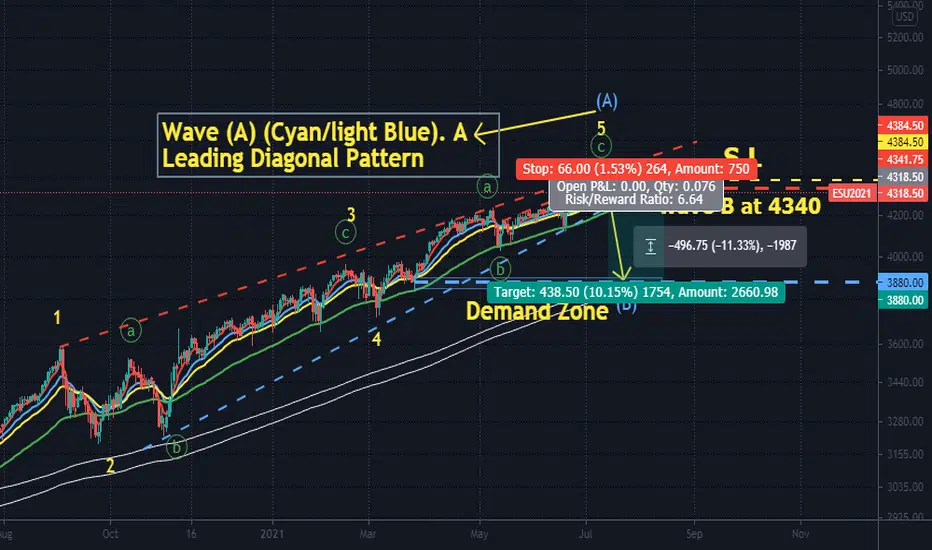
SPX with price breaking low of 4340 which is wave b of subwave of wave 5( Not shown on chart). SPX probably completed its leading diagonal pattern .. Short SPX toward around 3880 which is 1) Daily 200 EMA line 2) The Next Major Demand Zone ... Stop lost at 4384.50.... A Risk /Reward Ratio of about 6.64!
บันทึก
xyz3dtrading.. Charts consist of 3Dimensions - The X-factor ( Time or Cycle ), The Y- factor ( Price Geometry ), AND The Z-factor ( The Speed )บันทึก
It seem like SPX recent impulsive move down is a C leg of expanding flat pattern. SO SPX still will be breaking all time High again!คำจำกัดสิทธิ์ความรับผิดชอบ
ข้อมูลและบทความไม่ได้มีวัตถุประสงค์เพื่อก่อให้เกิดกิจกรรมทางการเงิน, การลงทุน, การซื้อขาย, ข้อเสนอแนะ หรือคำแนะนำประเภทอื่น ๆ ที่ให้หรือรับรองโดย TradingView อ่านเพิ่มเติมใน ข้อกำหนดการใช้งาน
คำจำกัดสิทธิ์ความรับผิดชอบ
ข้อมูลและบทความไม่ได้มีวัตถุประสงค์เพื่อก่อให้เกิดกิจกรรมทางการเงิน, การลงทุน, การซื้อขาย, ข้อเสนอแนะ หรือคำแนะนำประเภทอื่น ๆ ที่ให้หรือรับรองโดย TradingView อ่านเพิ่มเติมใน ข้อกำหนดการใช้งาน