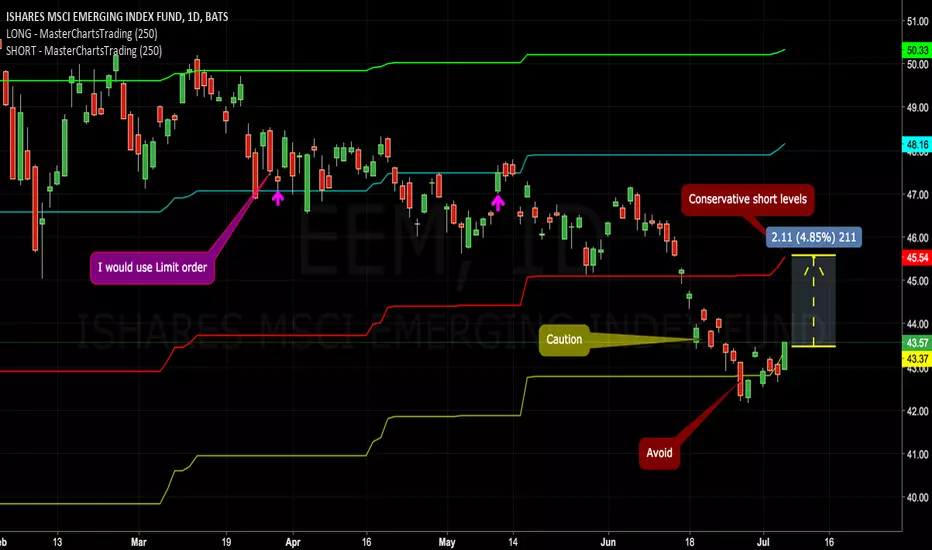
The Blue indicator line serves as a Bullish Trend setter.
If your instrument closes above the Blue line, we think about going Long.
If your instrument closes below the Red line, we think about Shorting.
For Stocks, I prefer to use the Yellow line as my Bearish Trend setter (on Daily charts).
Find out more. Send Private Mail (PM) to mastercharts
FREE Trial of These Indicators. Sign-Up for access here: masterchartstrading.com/store/c1/Featured_Products.html
Visit my financial blog & get alerts : masterchartstrading.com/blog
@mastercharts
Visit my financial blog & get alerts : masterchartstrading.com/blog
@mastercharts
การนำเสนอที่เกี่ยวข้อง
คำจำกัดสิทธิ์ความรับผิดชอบ
ข้อมูลและบทความไม่ได้มีวัตถุประสงค์เพื่อก่อให้เกิดกิจกรรมทางการเงิน, การลงทุน, การซื้อขาย, ข้อเสนอแนะ หรือคำแนะนำประเภทอื่น ๆ ที่ให้หรือรับรองโดย TradingView อ่านเพิ่มเติมที่ ข้อกำหนดการใช้งาน