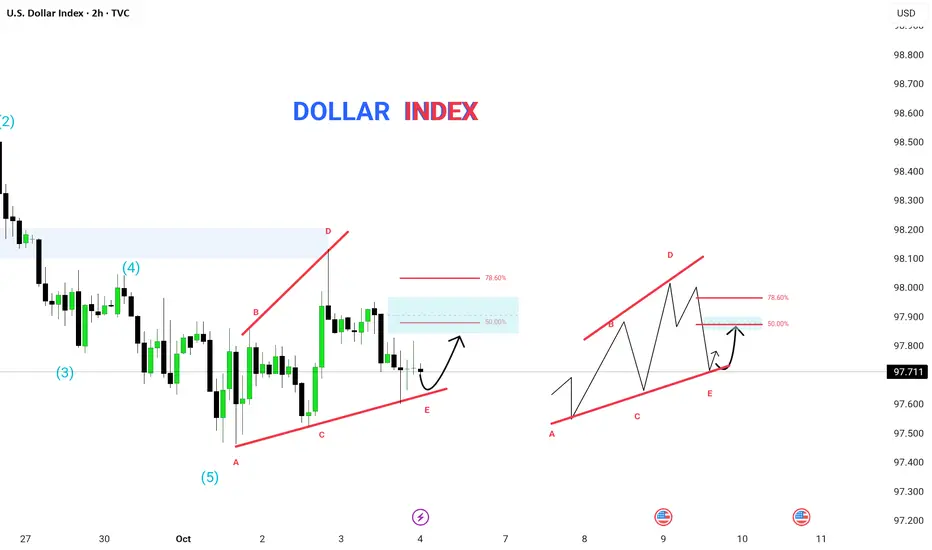
The US Dollar Index (2H timeframe) is currently developing a corrective wedge structure (A–B–C–D–E) following a completed 5-wave bearish impulse. The current price action suggests a potential bullish correction from the E-point.
🔹 Technical Structure Breakdown:
The previous bearish leg completed a Wave (5), marking the end of an impulse cycle.
Price is now consolidating within a rising wedge pattern, forming the A–B–C–D–E structure.
The E-point is acting as a near-term support, aligning with the ascending wedge base.
Retracement targets:
50.0% → short-term correction level
78.6% → ideal reversal zone before continuation
📊 Key Levels to Watch:
Support Zone: 97.600 – 97.500
Resistance Zone: 97.900 – 98.100
Fib Targets: 50% and 78.6% retracement of the recent swing
⚡ Analyst View:
The E-point bounce could lead to a short-term bullish corrective move toward the 50–78.6% Fibonacci levels before resuming the next bearish leg as part of a broader downtrend.
Traders should monitor reaction at the wedge top for possible rejection and reversal confirmation.
🧠 Pattern: Rising Wedge inside corrective phase
🕓 Timeframe: 2H
💰 Instrument: US Dollar Index (DXY)
🎯 Bias: Short-term bullish correction → medium-term bearish continuation
การนำเสนอที่เกี่ยวข้อง
คำจำกัดสิทธิ์ความรับผิดชอบ
ข้อมูลและบทความไม่ได้มีวัตถุประสงค์เพื่อก่อให้เกิดกิจกรรมทางการเงิน, การลงทุน, การซื้อขาย, ข้อเสนอแนะ หรือคำแนะนำประเภทอื่น ๆ ที่ให้หรือรับรองโดย TradingView อ่านเพิ่มเติมใน ข้อกำหนดการใช้งาน
การนำเสนอที่เกี่ยวข้อง
คำจำกัดสิทธิ์ความรับผิดชอบ
ข้อมูลและบทความไม่ได้มีวัตถุประสงค์เพื่อก่อให้เกิดกิจกรรมทางการเงิน, การลงทุน, การซื้อขาย, ข้อเสนอแนะ หรือคำแนะนำประเภทอื่น ๆ ที่ให้หรือรับรองโดย TradingView อ่านเพิ่มเติมใน ข้อกำหนดการใช้งาน