📊 DRREDDY – Technical & Educational Snapshot
Ticker: NSE: DRREDDY | Sector: 💊 Pharma
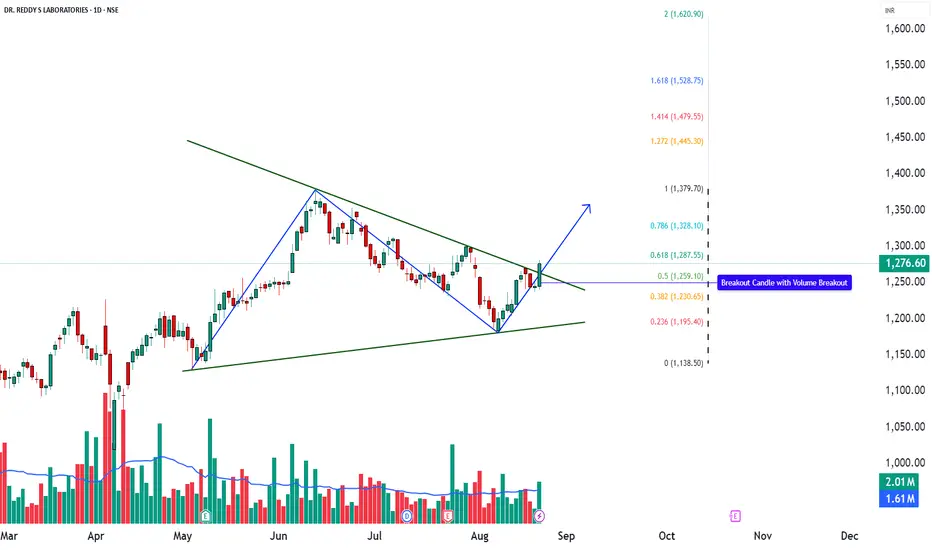
CMP: ₹1,276.60 ▲ (+2.51% | 22 Aug 2025)
Rating (for learning purpose): ⭐⭐⭐⭐ (Moderately Bullish)
Pattern Observed: 📈 Triangle Breakout with Volume Confirmation
📰 Sentiment Analysis
👉 Overall Sentiment: Positive ✅
• Bullish Drivers: Breakout from triangle formation, Morning Star on daily, bullish PinBar on monthly, strong Q1 results with revenue & profit growth, and renewed interest in pharma sector due to healthcare demand.
• Risks (Bearish Case): Any failure to sustain above ₹1,250 or renewed pressure from regulatory issues/patent challenges could trigger pullbacks.
• Short-term Outlook: Strong breakout with momentum, but some cooling-off likely due to Stochastic overbought levels.
• Long-term Outlook: Positive — consistent financial performance, strong pharma pipeline, and robust technical structure suggest higher upside potential.
📊 Technical Snapshot
DRREDDY has broken out from a triangle formation, supported by a Morning Star candlestick on the daily timeframe and a Bullish PinBar on the monthly chart — both strong reversal cues. A bullish Supertrend, RSI breakout, and Bollinger Band expansion signal renewed buying interest. Volume above the 20-SMA average further validates the breakout, suggesting institutional participation. While momentum is strong, Stochastic is near overbought, which means short-term pullbacks cannot be ruled out. However, as long as price sustains above key support zones, the broader trend bias remains upward.
📊 Volume Check
🔹 Current Volume: 2.01M
🔹 20 SMA Volume: 1.61M ✅
💥 Above-average participation → confirms breakout reliability with demand expansion.
💡 Interpretation: Higher-than-average volumes in breakout zones indicate broader market participation and improve the chances of trend continuation.
💡 Learnings
Breakouts from consolidation patterns like triangles tend to extend into trending moves when supported by momentum indicators (RSI + MACD). Elevated CCI levels indicate consistent buying pressure, but traders should remain alert to possible short pullbacks, especially when Stochastic enters the overbought zone. Defining a stop-loss and invalidation level is key for disciplined trade management.
📌 Key Levels
Resistance: 1292 | 1308 | 1334
Support: 1251 | 1225 | 1209
Fibonacci Levels: 1138.50 | 1195.40 | 1230.65 | 1259.10 | 1287.55 | 1328.10 | 1379.70
🎯 STWP Learning Reference
• Observed breakout zone: ~1281.8
• Key support level: ~1236
• Upside reference zones (if momentum continues): 1327 | 1372
• Pullback watch zone: 1224–1230 (where demand has earlier emerged)
• Invalidation reference: Below 1195 (trend may weaken)
⚠️ Disclaimer – Please Read Carefully
The information shared here is meant purely for learning and awareness. It is not a buy or sell recommendation and should not be taken as investment advice. I am not a SEBI-registered investment advisor, and all views expressed are based on personal study, chart patterns, and publicly available market data.
Trading — whether in stocks or options — carries risk. Markets can move unexpectedly, and losses can sometimes exceed the money you have invested. Past performance or past setups do not guarantee future results.
If you are a beginner, treat this as a guide to understand how the market works — practice on paper trades before risking real money. If you are experienced, always assess your own risk, position sizing, and strategy suitability before entering trades.
Consult a SEBI-registered financial advisor before making any real trading decision. By engaging with this content, you acknowledge full responsibility for your trades and investments.
💬 Found this useful?
🔼 Give this post a Boost to help more traders discover clean, structured learning.
✍️ Drop your thoughts, questions, or setups in the comments — let’s grow together!
🔁 Share with fellow traders and beginners to spread awareness.
✅ Follow simpletradewithpatience for beginner-friendly setups, price action insights & disciplined trading content.
🚀 Stay Calm. Stay Clean. Trade With Patience.
Trade Smart | Learn Zones | Be Self-Reliant 📊
Ticker: NSE: DRREDDY | Sector: 💊 Pharma
CMP: ₹1,276.60 ▲ (+2.51% | 22 Aug 2025)
Rating (for learning purpose): ⭐⭐⭐⭐ (Moderately Bullish)
Pattern Observed: 📈 Triangle Breakout with Volume Confirmation
📰 Sentiment Analysis
👉 Overall Sentiment: Positive ✅
• Bullish Drivers: Breakout from triangle formation, Morning Star on daily, bullish PinBar on monthly, strong Q1 results with revenue & profit growth, and renewed interest in pharma sector due to healthcare demand.
• Risks (Bearish Case): Any failure to sustain above ₹1,250 or renewed pressure from regulatory issues/patent challenges could trigger pullbacks.
• Short-term Outlook: Strong breakout with momentum, but some cooling-off likely due to Stochastic overbought levels.
• Long-term Outlook: Positive — consistent financial performance, strong pharma pipeline, and robust technical structure suggest higher upside potential.
📊 Technical Snapshot
DRREDDY has broken out from a triangle formation, supported by a Morning Star candlestick on the daily timeframe and a Bullish PinBar on the monthly chart — both strong reversal cues. A bullish Supertrend, RSI breakout, and Bollinger Band expansion signal renewed buying interest. Volume above the 20-SMA average further validates the breakout, suggesting institutional participation. While momentum is strong, Stochastic is near overbought, which means short-term pullbacks cannot be ruled out. However, as long as price sustains above key support zones, the broader trend bias remains upward.
📊 Volume Check
🔹 Current Volume: 2.01M
🔹 20 SMA Volume: 1.61M ✅
💥 Above-average participation → confirms breakout reliability with demand expansion.
💡 Interpretation: Higher-than-average volumes in breakout zones indicate broader market participation and improve the chances of trend continuation.
💡 Learnings
Breakouts from consolidation patterns like triangles tend to extend into trending moves when supported by momentum indicators (RSI + MACD). Elevated CCI levels indicate consistent buying pressure, but traders should remain alert to possible short pullbacks, especially when Stochastic enters the overbought zone. Defining a stop-loss and invalidation level is key for disciplined trade management.
📌 Key Levels
Resistance: 1292 | 1308 | 1334
Support: 1251 | 1225 | 1209
Fibonacci Levels: 1138.50 | 1195.40 | 1230.65 | 1259.10 | 1287.55 | 1328.10 | 1379.70
🎯 STWP Learning Reference
• Observed breakout zone: ~1281.8
• Key support level: ~1236
• Upside reference zones (if momentum continues): 1327 | 1372
• Pullback watch zone: 1224–1230 (where demand has earlier emerged)
• Invalidation reference: Below 1195 (trend may weaken)
⚠️ Disclaimer – Please Read Carefully
The information shared here is meant purely for learning and awareness. It is not a buy or sell recommendation and should not be taken as investment advice. I am not a SEBI-registered investment advisor, and all views expressed are based on personal study, chart patterns, and publicly available market data.
Trading — whether in stocks or options — carries risk. Markets can move unexpectedly, and losses can sometimes exceed the money you have invested. Past performance or past setups do not guarantee future results.
If you are a beginner, treat this as a guide to understand how the market works — practice on paper trades before risking real money. If you are experienced, always assess your own risk, position sizing, and strategy suitability before entering trades.
Consult a SEBI-registered financial advisor before making any real trading decision. By engaging with this content, you acknowledge full responsibility for your trades and investments.
💬 Found this useful?
🔼 Give this post a Boost to help more traders discover clean, structured learning.
✍️ Drop your thoughts, questions, or setups in the comments — let’s grow together!
🔁 Share with fellow traders and beginners to spread awareness.
✅ Follow simpletradewithpatience for beginner-friendly setups, price action insights & disciplined trading content.
🚀 Stay Calm. Stay Clean. Trade With Patience.
Trade Smart | Learn Zones | Be Self-Reliant 📊
📊 STWP | Mentor | Demand & Supply Specialist
🎯 Helping you become a self-reliant & independent trader
🎓 Learn more: simpletradewithpatience.com
📲 WhatsApp: wa.me/919987567889
🔍 Trade with Clarity. Learn with Patience.
🎯 Helping you become a self-reliant & independent trader
🎓 Learn more: simpletradewithpatience.com
📲 WhatsApp: wa.me/919987567889
🔍 Trade with Clarity. Learn with Patience.
คำจำกัดสิทธิ์ความรับผิดชอบ
ข้อมูลและบทความไม่ได้มีวัตถุประสงค์เพื่อก่อให้เกิดกิจกรรมทางการเงิน, การลงทุน, การซื้อขาย, ข้อเสนอแนะ หรือคำแนะนำประเภทอื่น ๆ ที่ให้หรือรับรองโดย TradingView อ่านเพิ่มเติมที่ ข้อกำหนดการใช้งาน