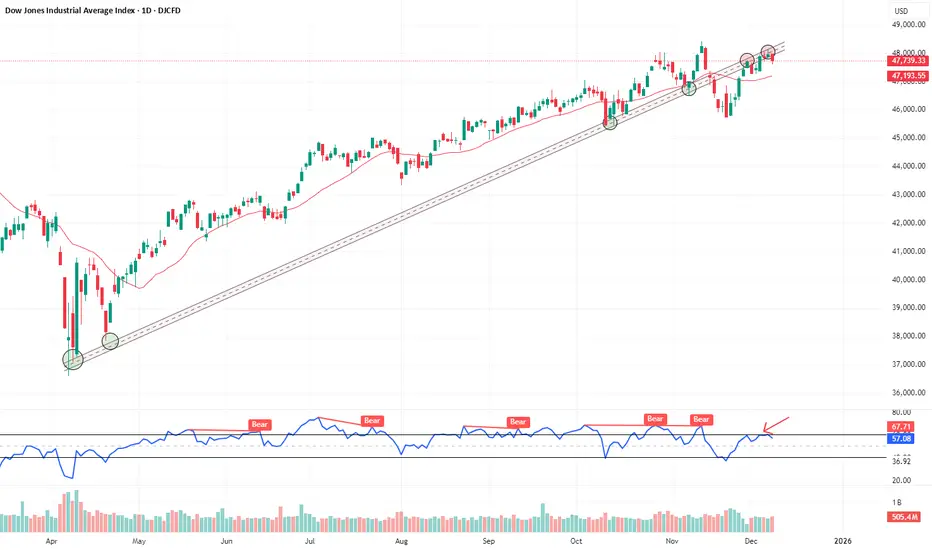
Clear trendline role reversal in play — previous support now acting as strong resistance📉
Price rejection seen near:
🔹 Trendline resistance
🔹 RSI bearish range shift (marked by repeated failures to cross 60)
🔹 Fib 0.786 retracement zone (not shown in chart)
All confluences suggest a potential pause or short-term pullback unless price breaks out with strong volume.
Price rejection seen near:
🔹 Trendline resistance
🔹 RSI bearish range shift (marked by repeated failures to cross 60)
🔹 Fib 0.786 retracement zone (not shown in chart)
All confluences suggest a potential pause or short-term pullback unless price breaks out with strong volume.
คำจำกัดสิทธิ์ความรับผิดชอบ
ข้อมูลและบทความไม่ได้มีวัตถุประสงค์เพื่อก่อให้เกิดกิจกรรมทางการเงิน, การลงทุน, การซื้อขาย, ข้อเสนอแนะ หรือคำแนะนำประเภทอื่น ๆ ที่ให้หรือรับรองโดย TradingView อ่านเพิ่มเติมใน ข้อกำหนดการใช้งาน
คำจำกัดสิทธิ์ความรับผิดชอบ
ข้อมูลและบทความไม่ได้มีวัตถุประสงค์เพื่อก่อให้เกิดกิจกรรมทางการเงิน, การลงทุน, การซื้อขาย, ข้อเสนอแนะ หรือคำแนะนำประเภทอื่น ๆ ที่ให้หรือรับรองโดย TradingView อ่านเพิ่มเติมใน ข้อกำหนดการใช้งาน