📌 Dixon Technologies (NSE: DIXON) – Key Levels & Market Outlook
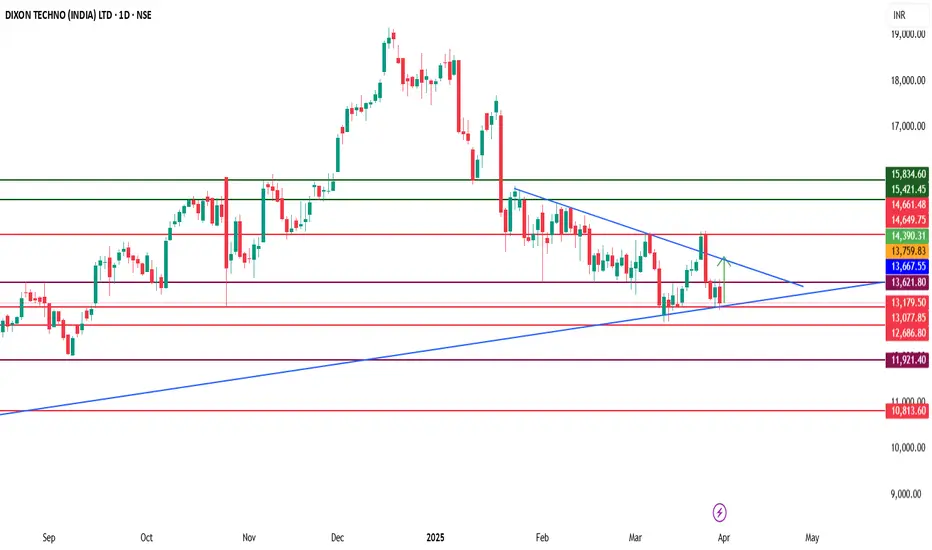
Dixon Technologies (DIXON) is currently trading above a crucial support zone of ₹13,000-₹12,800. If the stock sustains this level and breaks above the ₹13,630 resistance, it could see an upside move toward ₹14,000-₹14,600. However, a breakdown below ₹12,800 may lead to further downside pressure.
🔍 Technical Indicators:
📊 Supertrend (10,3): The indicator is currently in a buy mode, supporting a bullish outlook as long as ₹12,800 holds.
📈 Fibonacci Retracement: The ₹13,630 resistance aligns with a key retracement level; a breakout above this could confirm strength.
📉 ADX (Average Directional Index): Currently at 23, suggesting a developing trend; a move above 25-30 would indicate strong bullish momentum.
📊 OBV (On-Balance Volume): Rising OBV signals strong accumulation, supporting an upward breakout scenario.
📌 Key Levels to Watch:
✅ Support Zone: ₹13,000-₹12,800
📍 Resistance Level: ₹13,630
🚀 Upside Targets: ₹14,000-₹14,600
⚠ Breakdown Risk: Below ₹12,800, the stock may slide toward ₹12,500.
A sustained move above ₹13,630 could accelerate buying momentum, pushing Dixon toward ₹14,000-₹14,600. On the other hand, a break below ₹12,800 may invite selling pressure. Keep an eye on sector trends, demand in electronics, and institutional activity for further confirmation.
คำจำกัดสิทธิ์ความรับผิดชอบ
ข้อมูลและบทความไม่ได้มีวัตถุประสงค์เพื่อก่อให้เกิดกิจกรรมทางการเงิน, การลงทุน, การซื้อขาย, ข้อเสนอแนะ หรือคำแนะนำประเภทอื่น ๆ ที่ให้หรือรับรองโดย TradingView อ่านเพิ่มเติมที่ ข้อกำหนดการใช้งาน
คำจำกัดสิทธิ์ความรับผิดชอบ
ข้อมูลและบทความไม่ได้มีวัตถุประสงค์เพื่อก่อให้เกิดกิจกรรมทางการเงิน, การลงทุน, การซื้อขาย, ข้อเสนอแนะ หรือคำแนะนำประเภทอื่น ๆ ที่ให้หรือรับรองโดย TradingView อ่านเพิ่มเติมที่ ข้อกำหนดการใช้งาน