Maybe its is 'parabonoma'
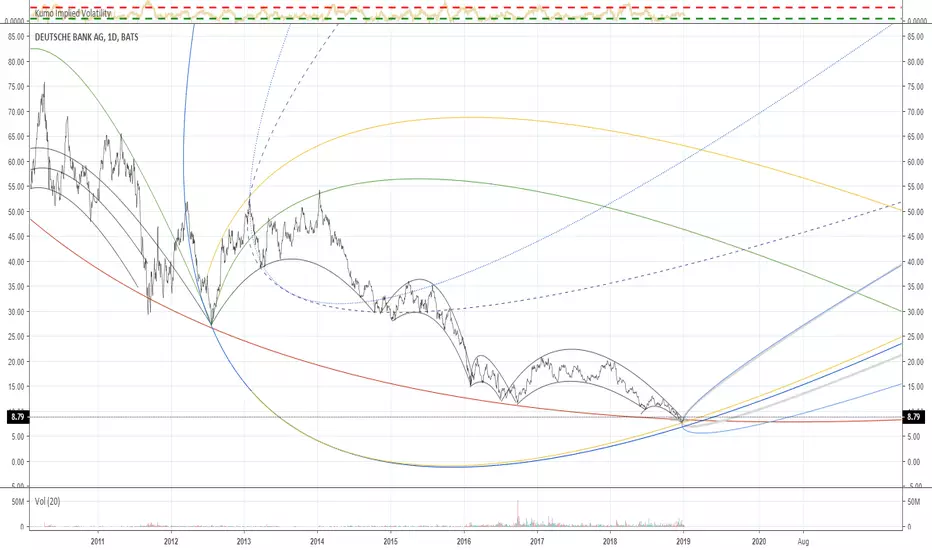
21 March 2012, to 24 July 2012
this maps to the present moment.
that is the corridor in Solid Blue/yellow dividing bilaterally the parabolas engendered by the break out of life. Will it survive. . . Cliff hanger
Is this phenomena, math? Weird chaos ripples?
21 March 2012, to 24 July 2012
this maps to the present moment.
that is the corridor in Solid Blue/yellow dividing bilaterally the parabolas engendered by the break out of life. Will it survive. . . Cliff hanger
Is this phenomena, math? Weird chaos ripples?
บันทึก
The curves are focused when the Blue and Yellow are focused. These are the same line. If They appear close, that is where in the pan the other parabolas are accurate.บันทึก
This chart, in review, is the prescient one./การนำเสนอที่เกี่ยวข้อง
คำจำกัดสิทธิ์ความรับผิดชอบ
ข้อมูลและบทความไม่ได้มีวัตถุประสงค์เพื่อก่อให้เกิดกิจกรรมทางการเงิน, การลงทุน, การซื้อขาย, ข้อเสนอแนะ หรือคำแนะนำประเภทอื่น ๆ ที่ให้หรือรับรองโดย TradingView อ่านเพิ่มเติมที่ ข้อกำหนดการใช้งาน
การนำเสนอที่เกี่ยวข้อง
คำจำกัดสิทธิ์ความรับผิดชอบ
ข้อมูลและบทความไม่ได้มีวัตถุประสงค์เพื่อก่อให้เกิดกิจกรรมทางการเงิน, การลงทุน, การซื้อขาย, ข้อเสนอแนะ หรือคำแนะนำประเภทอื่น ๆ ที่ให้หรือรับรองโดย TradingView อ่านเพิ่มเติมที่ ข้อกำหนดการใช้งาน