DABUR INDIA LTD (NSE: DABUR) | Triangle Breakout with Volume Surge
Daily Chart Analysis | July 7, 2025
Technical Highlights:
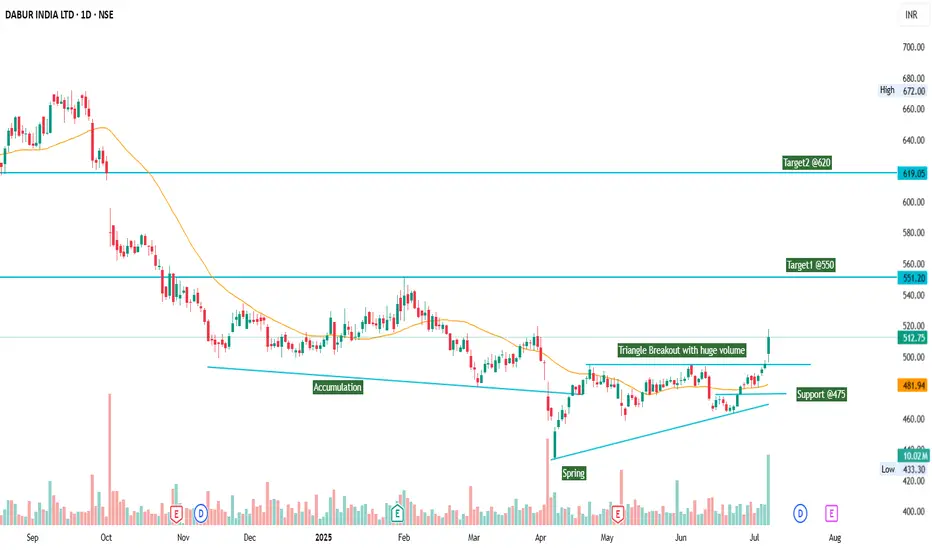
🔹 Accumulation Zone followed by a classic Spring — indicating smart money entry.
🔹 Symmetrical Triangle Formation observed over the last few months.
🔹 Today’s strong breakout candle on high volume confirms a bullish breakout from the triangle.
🔹 Immediate support at ₹475.
🔹 Price is now trading above the 30-day SMA — trend reversal confirmation.
Target Projections:
🎯 Target 1: ₹550
🎯 Target 2: ₹620
This setup offers a favorable risk-to-reward opportunity for swing traders. Watch for sustained volume and follow-through price action in Lower time frame (1Hr).
💡 Disclaimer: This is not financial advice. Please do your own analysis before investing.
Daily Chart Analysis | July 7, 2025
Technical Highlights:
🔹 Accumulation Zone followed by a classic Spring — indicating smart money entry.
🔹 Symmetrical Triangle Formation observed over the last few months.
🔹 Today’s strong breakout candle on high volume confirms a bullish breakout from the triangle.
🔹 Immediate support at ₹475.
🔹 Price is now trading above the 30-day SMA — trend reversal confirmation.
Target Projections:
🎯 Target 1: ₹550
🎯 Target 2: ₹620
This setup offers a favorable risk-to-reward opportunity for swing traders. Watch for sustained volume and follow-through price action in Lower time frame (1Hr).
💡 Disclaimer: This is not financial advice. Please do your own analysis before investing.
คำจำกัดสิทธิ์ความรับผิดชอบ
ข้อมูลและบทความไม่ได้มีวัตถุประสงค์เพื่อก่อให้เกิดกิจกรรมทางการเงิน, การลงทุน, การซื้อขาย, ข้อเสนอแนะ หรือคำแนะนำประเภทอื่น ๆ ที่ให้หรือรับรองโดย TradingView อ่านเพิ่มเติมที่ ข้อกำหนดการใช้งาน
คำจำกัดสิทธิ์ความรับผิดชอบ
ข้อมูลและบทความไม่ได้มีวัตถุประสงค์เพื่อก่อให้เกิดกิจกรรมทางการเงิน, การลงทุน, การซื้อขาย, ข้อเสนอแนะ หรือคำแนะนำประเภทอื่น ๆ ที่ให้หรือรับรองโดย TradingView อ่านเพิ่มเติมที่ ข้อกำหนดการใช้งาน