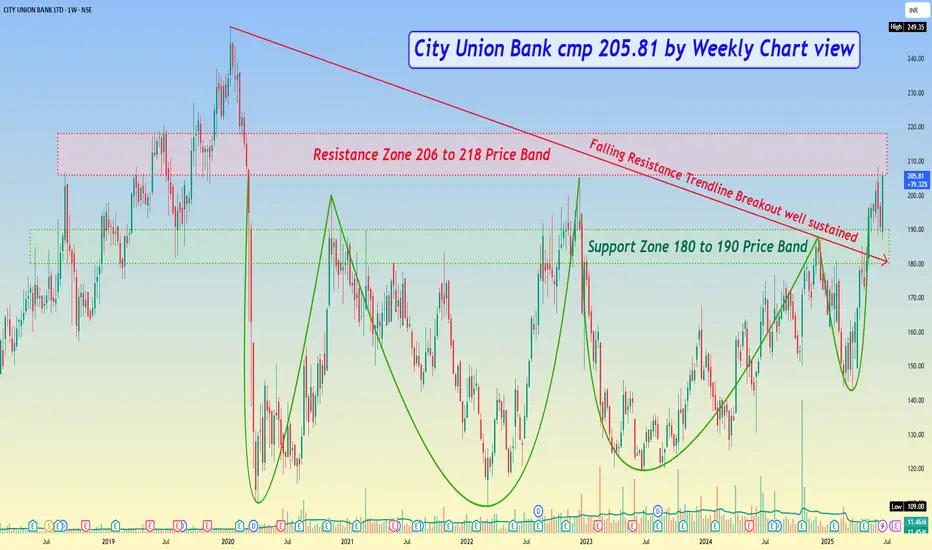
*City Union Bank cmp 205.81 by Weekly Chart view*
- Support Zone 180 to 190 Price Band
- Resistance Zone 206 to 218 Price Band
- Falling Resistance Trendline Breakout well sustained
- Technical Indicators of EMA, MACD, RSI on positive trend
- Repeated Bullish Rounding Bottoms with considerate Cup & Handle
- *Resistance Zone neckline acting as good hurdle to cross since breakdown in March 2020*
คำจำกัดสิทธิ์ความรับผิดชอบ
ข้อมูลและบทความไม่ได้มีวัตถุประสงค์เพื่อก่อให้เกิดกิจกรรมทางการเงิน, การลงทุน, การซื้อขาย, ข้อเสนอแนะ หรือคำแนะนำประเภทอื่น ๆ ที่ให้หรือรับรองโดย TradingView อ่านเพิ่มเติมใน ข้อกำหนดการใช้งาน
คำจำกัดสิทธิ์ความรับผิดชอบ
ข้อมูลและบทความไม่ได้มีวัตถุประสงค์เพื่อก่อให้เกิดกิจกรรมทางการเงิน, การลงทุน, การซื้อขาย, ข้อเสนอแนะ หรือคำแนะนำประเภทอื่น ๆ ที่ให้หรือรับรองโดย TradingView อ่านเพิ่มเติมใน ข้อกำหนดการใช้งาน