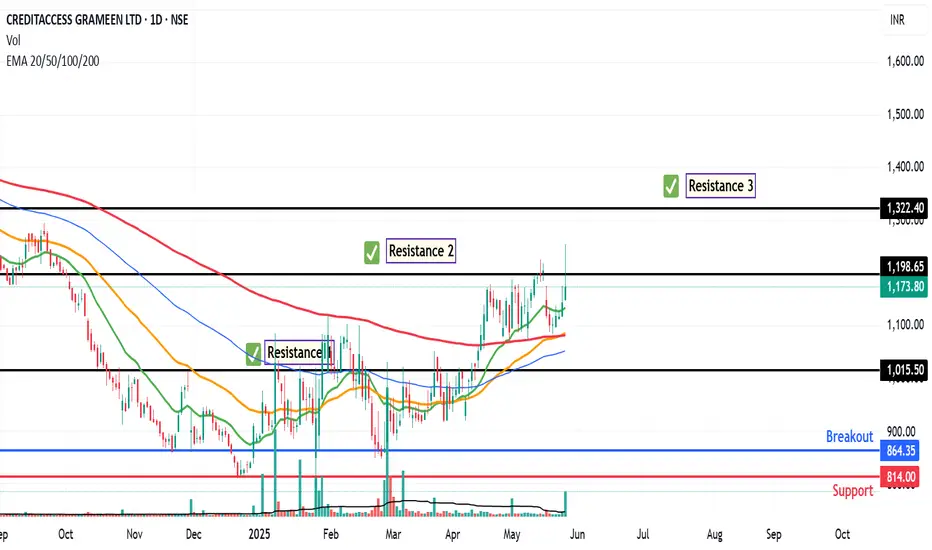
The chart of CREDITACC provides delineates critical price thresholds that signify breakout points, along with specific support levels that serve as indicators of where buying interest may manifest.
Additionally, the chart highlights regions likely to act as ceiling points for future price ascensions, allowing for informed decisions on entry and exit strategies.
Additionally, the chart highlights regions likely to act as ceiling points for future price ascensions, allowing for informed decisions on entry and exit strategies.
ปิดการเทรด: ถึงเป้าหมายการทำกำไร
Reached to Resistance 3. Trade Closeการนำเสนอที่เกี่ยวข้อง
คำจำกัดสิทธิ์ความรับผิดชอบ
ข้อมูลและบทความไม่ได้มีวัตถุประสงค์เพื่อก่อให้เกิดกิจกรรมทางการเงิน, การลงทุน, การซื้อขาย, ข้อเสนอแนะ หรือคำแนะนำประเภทอื่น ๆ ที่ให้หรือรับรองโดย TradingView อ่านเพิ่มเติมที่ ข้อกำหนดการใช้งาน
การนำเสนอที่เกี่ยวข้อง
คำจำกัดสิทธิ์ความรับผิดชอบ
ข้อมูลและบทความไม่ได้มีวัตถุประสงค์เพื่อก่อให้เกิดกิจกรรมทางการเงิน, การลงทุน, การซื้อขาย, ข้อเสนอแนะ หรือคำแนะนำประเภทอื่น ๆ ที่ให้หรือรับรองโดย TradingView อ่านเพิ่มเติมที่ ข้อกำหนดการใช้งาน