📊 **To view my confluences and linework:**
Step 1️⃣: Grab the chart
Step 2️⃣: Unhide Group 1 in the object tree
Step 3️⃣: Hide and unhide specific confluences one by one
💡 **Pro tip:** Double-click the screen to reveal RSI, MFI, CVD, and OBV indicators alongside divergence markings! 🎯
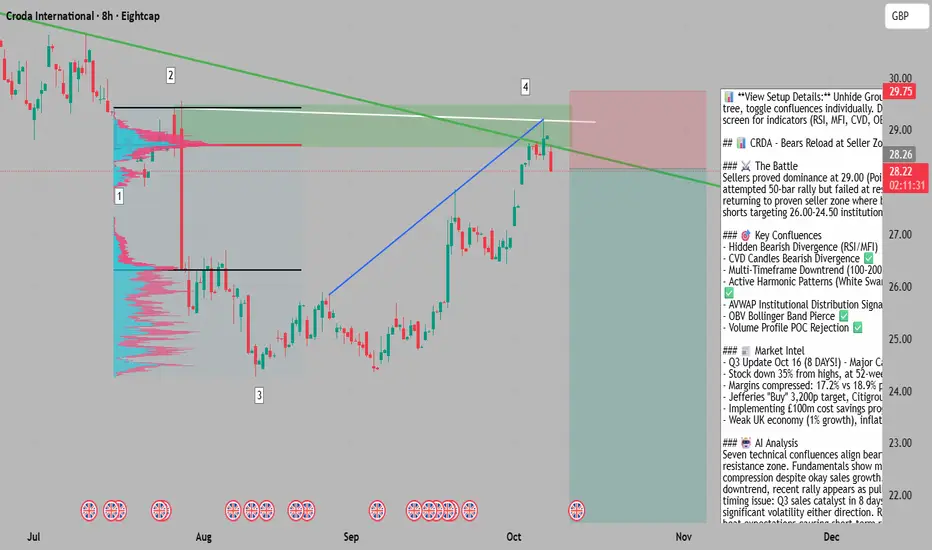
Title: 🎯 CRDA: Bears Reload at Proven Seller Zone - Bulls' Rally Fades
The Market Participant Battle:
Sellers established dominance at the 29.00 zone (Point 2) when price closed decisively below both Points 1 and 2, proving these participants as the market's controlling force. Bulls attempted a 50-bar counter-rally from the lows around 24.50, but this appears to be nothing more than a pullback within the broader 100-200 bar downtrend. Now, price has returned to the proven seller zone at Point 4 (29.00-29.75 area), where we're seeing immediate bearish reaction. The expectation? Sellers reassert control and drive price back toward the volume-weighted lows, targeting a retest of the 26.00-24.50 zone where institutional buyers may finally step in. This is a classic "return to scene of crime" setup where proven sellers get a second chance to short at favorable levels. 📉
Confluences:
Confluence 1: Hidden Bearish Divergence (RSI/MFI) 🔴
From Point 2 to Point 4, price action created a lower high in nominal terms, but BOTH RSI and MFI printed higher highs during this same period. This is textbook hidden bearish divergence - indicating that despite the recent rally, momentum is actually weakening and the uptrend is exhausted. The bulls couldn't muster enough buying pressure to break through overhead resistance, and momentum indicators are warning that this rally is running on fumes. This divergence pattern typically precedes significant moves lower, especially when it occurs at proven resistance zones. ✅ AGREES
Confluence 2: CVD Candles Bearish Divergence 📉
Recent price action made a higher high at Point 4, but the CVD (Cumulative Volume Delta) candles simultaneously made a lower high. This divergence reveals that institutional selling is outpacing buying even as price temporarily pushes higher - a clear sign of distribution. Smart money is using this rally to offload positions, creating a bearish undercurrent that retail buyers aren't seeing in the price action alone. When volume delta contradicts price movement like this, it's often the more reliable signal. ✅ AGREES
Confluence 3: Multi-Timeframe Trend Analysis 📊
The 100, 150, and 200-bar lookback periods all confirm a sustained downtrend. The recent 50-bar uptrend appears to be merely a pullback (bear flag) within this broader downward structure. This is critical context - we're not trying to catch a falling knife at lows, we're shorting a failed rally attempt back into overhead resistance. The trend structure heavily favors continuation to the downside, with the recent rally representing a typical counter-trend bounce that's now exhausted. ✅ AGREES
Confluence 4: Harmonic Patterns (White Swan & Partizan) 🦢
Both the White Swan and Partizan harmonic patterns are active on this chart, both bearish formations that suggest significant downside potential. These patterns represent specific Fibonacci-based price structures that historically precede strong directional moves. With both patterns activated simultaneously at the resistance zone, it reinforces the probability of downward continuation. These harmonics align with the other technical factors, creating a convergence of bearish signals. ✅ AGREES
Confluence 5: Anchored VWAP Analysis 🎯
Using AVWAP anchored from Point 1, price pushed above the 2nd standard deviation but closed back under, now heading toward the 1st deviation without ever reaching the 3rd deviation. This is a classic institutional entry pattern - institutions often enter positions when price reaches or exceeds 2 standard deviations and then reverses. The failure to reach the 3rd deviation before reversing suggests distribution rather than accumulation. This AVWAP behavior indicates smart money likely entered shorts as retail pushed price to extremes. ✅ AGREES
Confluence 6: OBV Bollinger Band Pierce 📈
At Point 4, On-Balance Volume pierced the upper Bollinger Band line, which typically signals an overbought condition and potential reversal. When OBV extends beyond the upper band at resistance, it often indicates exhaustion of buying pressure and warns of an imminent downturn. This technical signal has preceded many significant reversals, and its appearance at the proven seller zone strengthens the bearish case significantly. ✅ AGREES
Confluence 7: Volume Profile POC Return 📍
Fixed Range Volume Profile shows that price returned to the Point of Control (POC) at Point 4, which represents the price level with the highest traded volume in the range. The POC often acts as a magnet and battleground level. With price reaching the POC from below and showing immediate rejection (confirmed by other confluences), this suggests sellers are defending this level aggressively. A failed breakout above POC typically leads to a move back toward the lower end of the value area. ✅ AGREES
Web Research Findings:
- Technical Analysis: Multiple technical forecasting services rate CRDA as "Strong Sell" or within a "wide and falling trend." The stock has broken down through key support levels and is trading near 52-week lows (2,426.77p), having declined approximately 35% from its 52-week high of 4,335p. Technical analysts note the stock is in a persistent downtrend with weak momentum.
- Recent Earnings/Performance: Q1 2025 showed 8% sales growth (£442m), and H1 2025 delivered 7% constant currency growth. However, revenue for full year 2024 declined from 2023 levels (£1.81B vs £1.92B). Operating margins compressed from 18.9% (2023) to 17.2% (2024). Company maintains full-year guidance of £265-295m adjusted profit before tax. CRITICAL: Q3 sales update scheduled for Thursday, October 16, 2025 - just 8 days away.
- Analyst Sentiment: MIXED signals. Jefferies maintains "Buy" rating with 3,200p target (13% above current price). Citigroup has "Neutral" rating. Deutsche Bank cut target from 3,400p to 3,000p. Berenberg cut from 3,800p to 3,100p. Several price target reductions occurred in July-August 2025 timeframe. Notably, there's insider buying activity (Chris Good purchased 1,000 shares, Jacqui Ferguson bought 393 shares in August).
- Data Releases & Economic Calendar: IMMINENT CATALYST: Q3 2025 sales update due October 16, 2025 (8 days from now). This could be a significant volatility event. Next full earnings: February 24, 2026. Company has been implementing £100m cost savings program through end of 2027.
- Interest Rate Impact: UK base rate currently 4.0% (cut from 4.25% in August 2025). Next BoE decision November 6, 2025. UK inflation at 3.8% (above 2% target), creating headwinds for consumer-facing businesses. Weak UK economic growth (~1%) pressures specialty chemicals demand. A stronger GBP could hurt CRDA's exports (60% of sales outside Europe).
- Additional Context: Activist investor Standard Investments holds 5.48% stake, potentially pushing for strategic changes. Company is focused on Consumer Care and Life Sciences segments after selling industrial businesses. Some analysts note CRDA "has destroyed the most wealth of all current FTSE 350 members over past 2+ years."
Layman's Summary:
Here's what all this research means in simple terms for this trade: Croda is a UK specialty chemicals company that's been struggling. While their recent quarterly sales numbers have looked okay (up 7-8%), their actual profits have been shrinking and their stock price has been crushed - down 35% from highs. The company is in the middle of a big cost-cutting program because margins are under pressure.
For your short trade, there's both good news and a BIG timing issue. The good news: Most technical analysts think the stock will keep falling, the fundamentals show declining profitability despite okay sales, and the stock is clearly in a downtrend. The concerning news: They're releasing Q3 sales numbers on October 16th - that's only 8 days away. These quarterly updates have been beating expectations lately (Q1 and Q2 both came in better than expected), which caused short-term bounces.
So what does this mean for your trade? You've got strong technical setups pointing down, weak fundamentals, and a falling trend on your side. BUT you're entering right before a major news catalyst that could cause significant volatility. If they beat expectations again, you could see a sharp move against your position. If they miss or guide down, your short would accelerate beautifully. This is a "high conviction, bad timing" scenario. The direction is probably right, but the timing couldn't be worse with that earnings catalyst looming. 🎯
Machine Derived Information:
- Image 1 (8H Chart with Volume Profile): Shows descending trendline from highs, volume profile indicating heavy selling at Point 1 (cyan/pink bars), and price currently at Point 4 near 28.33 GBP resistance zone. Clear visual of the "return to seller zone" setup. Multiple reference points marked showing the progression from Point 1 (initial breakdown) through Point 3 (lows) to Point 4 (current rejection area). - Significance: Provides clear visual evidence of the market participant battle and established resistance levels. - AGREES ✔
- Image 2 (8H Chart with Channel Overlays): Displays black channel lines, moving averages (red and cyan), and confirms the lower high structure from Point 2 to Point 4. Shows how price is respecting the downward channel and rejecting from upper boundary. - Significance: Reinforces the downtrend structure and shows price struggling at channel resistance, validating the short setup. - AGREES ✔
- Image 3 (Indicators Panel - RSI, MFI, CVD, OBV): Critical divergence evidence visible. RSI shows higher high with white trendline while price made lower high (hidden bearish divergence marked as "Bear"). MFI displays similar pattern. CVD Candles show declining blue trendline (lower high) as price rose. OBV piercing upper Bollinger Band at Point 4. - Significance: Provides quantitative proof of momentum divergences and volume exhaustion. Multiple indicators simultaneously showing bearish signals at the same resistance level is powerful confirmation. - AGREES ✔
- Image 4 (Daily/Longer-Term View): Shows the broader multi-month downtrend from ~34.00 area, with clear lower highs and lower lows pattern. Recent rally from 24.00 to 29.00 appears as a pullback within larger trend. Descending trendline from highs acting as resistance. - Significance: Essential context showing this is not a reversal attempt at bottoms, but a short opportunity at resistance within an established downtrend. The macro picture supports bearish continuation. - AGREES ✔
Actionable Machine Summary:
All four chart images tell a cohesive bearish story. The setup shows sellers established control at 29.00 (Point 2), bulls attempted a rally but couldn't break through, and now price has returned to that proven seller zone with multiple technical divergences flashing red. The 8H timeframe shows precise entry opportunities with clear resistance levels, while the daily timeframe confirms we're operating within a larger downtrend. The indicator panel provides irrefutable evidence of momentum exhaustion and volume weakness at this critical level.
For trade execution: Entry zone is 28.30-29.75 (current area where rejections are occurring). Stop loss should be placed above 30.00-30.50 to allow for some noise while protecting against a breakout above resistance. Primary target zone is 26.00-26.50 (volume support area), with extended targets around 24.50-25.00 if momentum accelerates (Point 3 area retest). Risk/reward is favorable given the proximity to resistance and distance to support zones. However, traders must be aware of the October 16th Q3 catalyst - consider reducing position size before this event or using wider stops to account for potential volatility. The technical setup is strong, but timing around earnings creates elevated risk. 🎯
Conclusion:
Trade Prediction: CAUTIOUS SUCCESS ⚠️✅
Confidence: Medium
Key Reasons for Success:
1. ✅ Seven Aligned Technical Confluences: Hidden bearish divergence (RSI/MFI), CVD divergence, multi-timeframe downtrend, active harmonic patterns, AVWAP institutional signal, OBV exhaustion, and volume profile POC rejection all point toward downside
2. ✅ Fundamental Headwinds: Declining revenues YoY, compressed margins (17.2% vs 18.9%), weak UK economic environment, and company implementing major cost-cutting program
3. ✅ Technical Consensus: Multiple forecasting services rate as "Strong Sell" with stock in "wide and falling trend"
4. ✅ Clear Market Structure: Established downtrend on 100-200 bar lookback, recent rally is pullback within larger trend, textbook "return to resistance" setup
5. ✅ Smart Money Signals: AVWAP showing institutional distribution, CVD divergence indicating hidden selling pressure despite rising prices
Key Risks/Reasons for Caution:
1. ⚠️ IMMINENT CATALYST RISK: Q3 sales update October 16th (8 days away) - this is the biggest risk. Recent quarters beat expectations, causing short-term rallies
2. ⚠️ Mixed Analyst Sentiment: Not unanimous - Jefferies "Buy" with 3,200p target, Citigroup "Neutral", sentiment is 50-60% bearish not 80%+
3. ⚠️ Already Significantly Beaten Down: Stock down 35% from highs, at 52-week lows (2,426p) - limited downside vs potential for relief rally
4. ⚠️ Recent Sales Momentum: Q1 +8%, H1 +7% sales growth - company showing operational improvement even if margins compressed
5. ⚠️ Insider Buying Activity: Executives purchasing shares in August suggests some internal confidence
Risk/Reward Assessment:
From technical standpoint, R/R is attractive: ~1.5% to resistance (29.75) vs ~8-12% to support targets (26.00-24.50 area), offering 5:1 to 8:1 R/R ratio. However, the October 16th catalyst introduces significant event risk that could trigger 3-5% moves in either direction within hours. The technical setup is sound, the fundamental backdrop supports downside, but the timing is problematic.
Final Recommendation: TAKE THE TRADE WITH REDUCED SIZE 📉
This is a technically solid short setup with strong confluence alignment and supportive fundamentals. However, the imminent Q3 catalyst (8 days away) requires position sizing adjustment. Here's the action plan:
Recommended Approach:
- Enter 50% of intended position size now at 28.30-29.00
- Set stop loss at 30.25 (above resistance, tight but reasonable)
- Primary target: 26.00-26.50 (8-10% downside)
- Extended target: 24.50-25.00 (13-15% downside)
- CRITICAL: Either close position before October 16th or use wider stops (31.00+) to handle earnings volatility
- Alternative: Wait until after October 16th Q3 release, then re-enter if stock rallies on news (potentially at even better prices)
The trade direction is likely correct - sellers appear to be defending the 29.00 zone and fundamentals/technicals support downside. But entering right before a known catalyst reduces the edge. A prudent trader would either: (1) take smaller position with wider stops, (2) close before the event, or (3) wait for post-earnings clarity. Don't let perfect technical setups override basic risk management around known catalysts.
Rating: ⭐⭐⭐⭐ (4/5 stars - excellent setup, problematic timing)
The stars align technically and fundamentally, but the October 16th Q3 update creates a timing headwind that drops this from a 5-star slam dunk to a 4-star "proceed with caution" trade. Respect the setup, but respect the calendar even more. 🎯
Step 1️⃣: Grab the chart
Step 2️⃣: Unhide Group 1 in the object tree
Step 3️⃣: Hide and unhide specific confluences one by one
💡 **Pro tip:** Double-click the screen to reveal RSI, MFI, CVD, and OBV indicators alongside divergence markings! 🎯
Title: 🎯 CRDA: Bears Reload at Proven Seller Zone - Bulls' Rally Fades
The Market Participant Battle:
Sellers established dominance at the 29.00 zone (Point 2) when price closed decisively below both Points 1 and 2, proving these participants as the market's controlling force. Bulls attempted a 50-bar counter-rally from the lows around 24.50, but this appears to be nothing more than a pullback within the broader 100-200 bar downtrend. Now, price has returned to the proven seller zone at Point 4 (29.00-29.75 area), where we're seeing immediate bearish reaction. The expectation? Sellers reassert control and drive price back toward the volume-weighted lows, targeting a retest of the 26.00-24.50 zone where institutional buyers may finally step in. This is a classic "return to scene of crime" setup where proven sellers get a second chance to short at favorable levels. 📉
Confluences:
Confluence 1: Hidden Bearish Divergence (RSI/MFI) 🔴
From Point 2 to Point 4, price action created a lower high in nominal terms, but BOTH RSI and MFI printed higher highs during this same period. This is textbook hidden bearish divergence - indicating that despite the recent rally, momentum is actually weakening and the uptrend is exhausted. The bulls couldn't muster enough buying pressure to break through overhead resistance, and momentum indicators are warning that this rally is running on fumes. This divergence pattern typically precedes significant moves lower, especially when it occurs at proven resistance zones. ✅ AGREES
Confluence 2: CVD Candles Bearish Divergence 📉
Recent price action made a higher high at Point 4, but the CVD (Cumulative Volume Delta) candles simultaneously made a lower high. This divergence reveals that institutional selling is outpacing buying even as price temporarily pushes higher - a clear sign of distribution. Smart money is using this rally to offload positions, creating a bearish undercurrent that retail buyers aren't seeing in the price action alone. When volume delta contradicts price movement like this, it's often the more reliable signal. ✅ AGREES
Confluence 3: Multi-Timeframe Trend Analysis 📊
The 100, 150, and 200-bar lookback periods all confirm a sustained downtrend. The recent 50-bar uptrend appears to be merely a pullback (bear flag) within this broader downward structure. This is critical context - we're not trying to catch a falling knife at lows, we're shorting a failed rally attempt back into overhead resistance. The trend structure heavily favors continuation to the downside, with the recent rally representing a typical counter-trend bounce that's now exhausted. ✅ AGREES
Confluence 4: Harmonic Patterns (White Swan & Partizan) 🦢
Both the White Swan and Partizan harmonic patterns are active on this chart, both bearish formations that suggest significant downside potential. These patterns represent specific Fibonacci-based price structures that historically precede strong directional moves. With both patterns activated simultaneously at the resistance zone, it reinforces the probability of downward continuation. These harmonics align with the other technical factors, creating a convergence of bearish signals. ✅ AGREES
Confluence 5: Anchored VWAP Analysis 🎯
Using AVWAP anchored from Point 1, price pushed above the 2nd standard deviation but closed back under, now heading toward the 1st deviation without ever reaching the 3rd deviation. This is a classic institutional entry pattern - institutions often enter positions when price reaches or exceeds 2 standard deviations and then reverses. The failure to reach the 3rd deviation before reversing suggests distribution rather than accumulation. This AVWAP behavior indicates smart money likely entered shorts as retail pushed price to extremes. ✅ AGREES
Confluence 6: OBV Bollinger Band Pierce 📈
At Point 4, On-Balance Volume pierced the upper Bollinger Band line, which typically signals an overbought condition and potential reversal. When OBV extends beyond the upper band at resistance, it often indicates exhaustion of buying pressure and warns of an imminent downturn. This technical signal has preceded many significant reversals, and its appearance at the proven seller zone strengthens the bearish case significantly. ✅ AGREES
Confluence 7: Volume Profile POC Return 📍
Fixed Range Volume Profile shows that price returned to the Point of Control (POC) at Point 4, which represents the price level with the highest traded volume in the range. The POC often acts as a magnet and battleground level. With price reaching the POC from below and showing immediate rejection (confirmed by other confluences), this suggests sellers are defending this level aggressively. A failed breakout above POC typically leads to a move back toward the lower end of the value area. ✅ AGREES
Web Research Findings:
- Technical Analysis: Multiple technical forecasting services rate CRDA as "Strong Sell" or within a "wide and falling trend." The stock has broken down through key support levels and is trading near 52-week lows (2,426.77p), having declined approximately 35% from its 52-week high of 4,335p. Technical analysts note the stock is in a persistent downtrend with weak momentum.
- Recent Earnings/Performance: Q1 2025 showed 8% sales growth (£442m), and H1 2025 delivered 7% constant currency growth. However, revenue for full year 2024 declined from 2023 levels (£1.81B vs £1.92B). Operating margins compressed from 18.9% (2023) to 17.2% (2024). Company maintains full-year guidance of £265-295m adjusted profit before tax. CRITICAL: Q3 sales update scheduled for Thursday, October 16, 2025 - just 8 days away.
- Analyst Sentiment: MIXED signals. Jefferies maintains "Buy" rating with 3,200p target (13% above current price). Citigroup has "Neutral" rating. Deutsche Bank cut target from 3,400p to 3,000p. Berenberg cut from 3,800p to 3,100p. Several price target reductions occurred in July-August 2025 timeframe. Notably, there's insider buying activity (Chris Good purchased 1,000 shares, Jacqui Ferguson bought 393 shares in August).
- Data Releases & Economic Calendar: IMMINENT CATALYST: Q3 2025 sales update due October 16, 2025 (8 days from now). This could be a significant volatility event. Next full earnings: February 24, 2026. Company has been implementing £100m cost savings program through end of 2027.
- Interest Rate Impact: UK base rate currently 4.0% (cut from 4.25% in August 2025). Next BoE decision November 6, 2025. UK inflation at 3.8% (above 2% target), creating headwinds for consumer-facing businesses. Weak UK economic growth (~1%) pressures specialty chemicals demand. A stronger GBP could hurt CRDA's exports (60% of sales outside Europe).
- Additional Context: Activist investor Standard Investments holds 5.48% stake, potentially pushing for strategic changes. Company is focused on Consumer Care and Life Sciences segments after selling industrial businesses. Some analysts note CRDA "has destroyed the most wealth of all current FTSE 350 members over past 2+ years."
Layman's Summary:
Here's what all this research means in simple terms for this trade: Croda is a UK specialty chemicals company that's been struggling. While their recent quarterly sales numbers have looked okay (up 7-8%), their actual profits have been shrinking and their stock price has been crushed - down 35% from highs. The company is in the middle of a big cost-cutting program because margins are under pressure.
For your short trade, there's both good news and a BIG timing issue. The good news: Most technical analysts think the stock will keep falling, the fundamentals show declining profitability despite okay sales, and the stock is clearly in a downtrend. The concerning news: They're releasing Q3 sales numbers on October 16th - that's only 8 days away. These quarterly updates have been beating expectations lately (Q1 and Q2 both came in better than expected), which caused short-term bounces.
So what does this mean for your trade? You've got strong technical setups pointing down, weak fundamentals, and a falling trend on your side. BUT you're entering right before a major news catalyst that could cause significant volatility. If they beat expectations again, you could see a sharp move against your position. If they miss or guide down, your short would accelerate beautifully. This is a "high conviction, bad timing" scenario. The direction is probably right, but the timing couldn't be worse with that earnings catalyst looming. 🎯
Machine Derived Information:
- Image 1 (8H Chart with Volume Profile): Shows descending trendline from highs, volume profile indicating heavy selling at Point 1 (cyan/pink bars), and price currently at Point 4 near 28.33 GBP resistance zone. Clear visual of the "return to seller zone" setup. Multiple reference points marked showing the progression from Point 1 (initial breakdown) through Point 3 (lows) to Point 4 (current rejection area). - Significance: Provides clear visual evidence of the market participant battle and established resistance levels. - AGREES ✔
- Image 2 (8H Chart with Channel Overlays): Displays black channel lines, moving averages (red and cyan), and confirms the lower high structure from Point 2 to Point 4. Shows how price is respecting the downward channel and rejecting from upper boundary. - Significance: Reinforces the downtrend structure and shows price struggling at channel resistance, validating the short setup. - AGREES ✔
- Image 3 (Indicators Panel - RSI, MFI, CVD, OBV): Critical divergence evidence visible. RSI shows higher high with white trendline while price made lower high (hidden bearish divergence marked as "Bear"). MFI displays similar pattern. CVD Candles show declining blue trendline (lower high) as price rose. OBV piercing upper Bollinger Band at Point 4. - Significance: Provides quantitative proof of momentum divergences and volume exhaustion. Multiple indicators simultaneously showing bearish signals at the same resistance level is powerful confirmation. - AGREES ✔
- Image 4 (Daily/Longer-Term View): Shows the broader multi-month downtrend from ~34.00 area, with clear lower highs and lower lows pattern. Recent rally from 24.00 to 29.00 appears as a pullback within larger trend. Descending trendline from highs acting as resistance. - Significance: Essential context showing this is not a reversal attempt at bottoms, but a short opportunity at resistance within an established downtrend. The macro picture supports bearish continuation. - AGREES ✔
Actionable Machine Summary:
All four chart images tell a cohesive bearish story. The setup shows sellers established control at 29.00 (Point 2), bulls attempted a rally but couldn't break through, and now price has returned to that proven seller zone with multiple technical divergences flashing red. The 8H timeframe shows precise entry opportunities with clear resistance levels, while the daily timeframe confirms we're operating within a larger downtrend. The indicator panel provides irrefutable evidence of momentum exhaustion and volume weakness at this critical level.
For trade execution: Entry zone is 28.30-29.75 (current area where rejections are occurring). Stop loss should be placed above 30.00-30.50 to allow for some noise while protecting against a breakout above resistance. Primary target zone is 26.00-26.50 (volume support area), with extended targets around 24.50-25.00 if momentum accelerates (Point 3 area retest). Risk/reward is favorable given the proximity to resistance and distance to support zones. However, traders must be aware of the October 16th Q3 catalyst - consider reducing position size before this event or using wider stops to account for potential volatility. The technical setup is strong, but timing around earnings creates elevated risk. 🎯
Conclusion:
Trade Prediction: CAUTIOUS SUCCESS ⚠️✅
Confidence: Medium
Key Reasons for Success:
1. ✅ Seven Aligned Technical Confluences: Hidden bearish divergence (RSI/MFI), CVD divergence, multi-timeframe downtrend, active harmonic patterns, AVWAP institutional signal, OBV exhaustion, and volume profile POC rejection all point toward downside
2. ✅ Fundamental Headwinds: Declining revenues YoY, compressed margins (17.2% vs 18.9%), weak UK economic environment, and company implementing major cost-cutting program
3. ✅ Technical Consensus: Multiple forecasting services rate as "Strong Sell" with stock in "wide and falling trend"
4. ✅ Clear Market Structure: Established downtrend on 100-200 bar lookback, recent rally is pullback within larger trend, textbook "return to resistance" setup
5. ✅ Smart Money Signals: AVWAP showing institutional distribution, CVD divergence indicating hidden selling pressure despite rising prices
Key Risks/Reasons for Caution:
1. ⚠️ IMMINENT CATALYST RISK: Q3 sales update October 16th (8 days away) - this is the biggest risk. Recent quarters beat expectations, causing short-term rallies
2. ⚠️ Mixed Analyst Sentiment: Not unanimous - Jefferies "Buy" with 3,200p target, Citigroup "Neutral", sentiment is 50-60% bearish not 80%+
3. ⚠️ Already Significantly Beaten Down: Stock down 35% from highs, at 52-week lows (2,426p) - limited downside vs potential for relief rally
4. ⚠️ Recent Sales Momentum: Q1 +8%, H1 +7% sales growth - company showing operational improvement even if margins compressed
5. ⚠️ Insider Buying Activity: Executives purchasing shares in August suggests some internal confidence
Risk/Reward Assessment:
From technical standpoint, R/R is attractive: ~1.5% to resistance (29.75) vs ~8-12% to support targets (26.00-24.50 area), offering 5:1 to 8:1 R/R ratio. However, the October 16th catalyst introduces significant event risk that could trigger 3-5% moves in either direction within hours. The technical setup is sound, the fundamental backdrop supports downside, but the timing is problematic.
Final Recommendation: TAKE THE TRADE WITH REDUCED SIZE 📉
This is a technically solid short setup with strong confluence alignment and supportive fundamentals. However, the imminent Q3 catalyst (8 days away) requires position sizing adjustment. Here's the action plan:
Recommended Approach:
- Enter 50% of intended position size now at 28.30-29.00
- Set stop loss at 30.25 (above resistance, tight but reasonable)
- Primary target: 26.00-26.50 (8-10% downside)
- Extended target: 24.50-25.00 (13-15% downside)
- CRITICAL: Either close position before October 16th or use wider stops (31.00+) to handle earnings volatility
- Alternative: Wait until after October 16th Q3 release, then re-enter if stock rallies on news (potentially at even better prices)
The trade direction is likely correct - sellers appear to be defending the 29.00 zone and fundamentals/technicals support downside. But entering right before a known catalyst reduces the edge. A prudent trader would either: (1) take smaller position with wider stops, (2) close before the event, or (3) wait for post-earnings clarity. Don't let perfect technical setups override basic risk management around known catalysts.
Rating: ⭐⭐⭐⭐ (4/5 stars - excellent setup, problematic timing)
The stars align technically and fundamentally, but the October 16th Q3 update creates a timing headwind that drops this from a 5-star slam dunk to a 4-star "proceed with caution" trade. Respect the setup, but respect the calendar even more. 🎯
for trading mentorship and community, message me on telegram : jacesabr_real
คำจำกัดสิทธิ์ความรับผิดชอบ
ข้อมูลและบทความไม่ได้มีวัตถุประสงค์เพื่อก่อให้เกิดกิจกรรมทางการเงิน, การลงทุน, การซื้อขาย, ข้อเสนอแนะ หรือคำแนะนำประเภทอื่น ๆ ที่ให้หรือรับรองโดย TradingView อ่านเพิ่มเติมที่ ข้อกำหนดการใช้งาน
for trading mentorship and community, message me on telegram : jacesabr_real
คำจำกัดสิทธิ์ความรับผิดชอบ
ข้อมูลและบทความไม่ได้มีวัตถุประสงค์เพื่อก่อให้เกิดกิจกรรมทางการเงิน, การลงทุน, การซื้อขาย, ข้อเสนอแนะ หรือคำแนะนำประเภทอื่น ๆ ที่ให้หรือรับรองโดย TradingView อ่านเพิ่มเติมที่ ข้อกำหนดการใช้งาน