Week Ahead Plan: September 2-6, 2025
Analysis Period: August 26-30, 2025 Review | September 2-6, 2025 Outlook
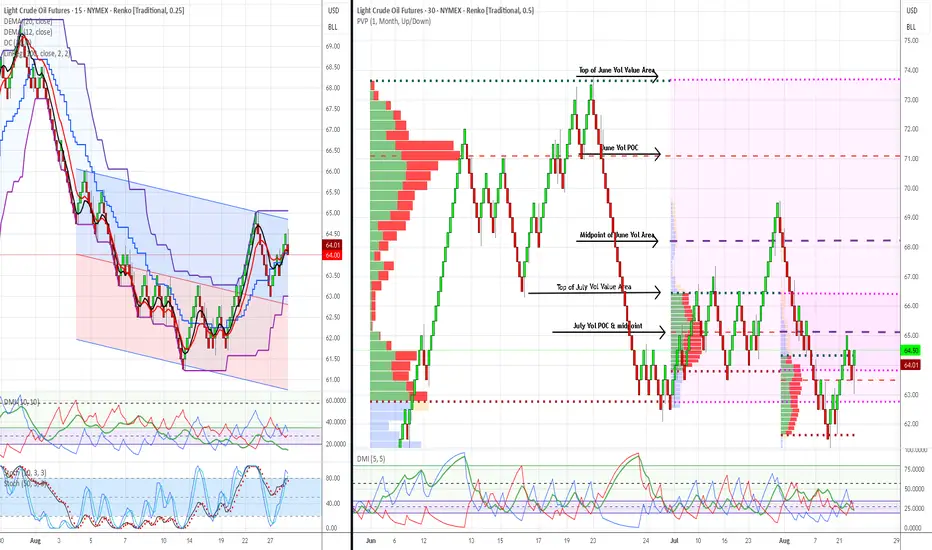
Market: WTI Crude Oil Futures (CL1!)
Methodology: Dual Renko Chart System ($0.25/15min + $0.50/30min)
Current Price: $64.00 (August 30, 2025)
________________________________________
Strategic Outlook & Market Setup
Primary Scenario (70% Probability): Pullback First, Then Recovery
What to Expect: Market opens lower Tuesday ($63.00-63.50 range) due to bearish signal on short-term chart. This creates a buying opportunity if support holds.
Trading Plan:
Secondary Scenario (25% Probability): Sideways Consolidation
What to Expect: Market trades in $63.50-64.50 range for several days while technical signals realign.
Trading Plan:
Low Probability Scenario (5% Probability): Immediate Continuation Up
What to Expect: Market gaps up above $64.25 and keeps rising.
Trading Plan:
________________________________________
Market Risk Factors & Monitoring
Critical Support Level: $62.00
Key Events This Week:
Warning Signs to Watch:
Positive Signs to Look For:
________________________________________
Forward-Looking Adjustments
Modified Risk Management:
Revised Entry Strategy:
Before Buying, Confirm ALL Three:
Timeline Expectations:
Success Metrics:
Simplified Decision Framework:
Green Light to Buy: Price near $62-63 + Short-term trend bullish + Good volume Yellow Light (Wait): Mixed signals, choppy price action, low volume
Red Light (Exit): Price below $62, bearish trend continuing, time limit exceeded
________________________________________
Bottom Line: The bigger picture remains bullish, but short-term signals suggest a pullback first. Use any weakness to $62-63 as a buying opportunity, but only with proper confirmation. Be patient - the setup is still valid but timing may be delayed by a few days.
________________________________________
Document Classification: Trading Analysis
Next Update: September 6, 2025 (Weekly Review)
Risk Level: Moderate (controlled institutional setup)
This analysis represents continued validation of a systematic, institutional-grade trading methodology with demonstrated predictive accuracy and risk control capabilities. This is a view that represents possible scenarios but ultimate responsibility is with each individual trader.
Risk Disclaimer: Past performance does not guarantee future results. All trading involves risk of loss.
Analysis Period: August 26-30, 2025 Review | September 2-6, 2025 Outlook
Market: WTI Crude Oil Futures (CL1!)
Methodology: Dual Renko Chart System ($0.25/15min + $0.50/30min)
Current Price: $64.00 (August 30, 2025)
________________________________________
Strategic Outlook & Market Setup
Primary Scenario (70% Probability): Pullback First, Then Recovery
What to Expect: Market opens lower Tuesday ($63.00-63.50 range) due to bearish signal on short-term chart. This creates a buying opportunity if support holds.
Trading Plan:
- Tuesday Opening: Expect gap down - don't panic, this was anticipated
- Buy Zone: Look for entries between $62.00-63.50 (strong institutional support)
- Confirmation Needed: Wait for short-term trend to flip bullish again before buying
- Target: Still aiming for $66.50 but may take extra 3-5 days to get there
Secondary Scenario (25% Probability): Sideways Consolidation
What to Expect: Market trades in $63.50-64.50 range for several days while technical signals realign.
Trading Plan:
- Strategy: Be patient - don't force trades in choppy conditions
- Wait For: Clear breakout above $64.50 with volume
- Risk: Could waste 1-2 weeks in sideways action
Low Probability Scenario (5% Probability): Immediate Continuation Up
What to Expect: Market gaps up above $64.25 and keeps rising.
Trading Plan:
- Verify: Make sure both short-term and long-term signals turn bullish
- Caution: Be skeptical without strong volume confirmation
- Action: Can buy but use smaller position sizes until confirmed
________________________________________
Market Risk Factors & Monitoring
Critical Support Level: $62.00
- Why Important: Massive institutional buying occurred here - if it breaks, the bullish case is dead
- Action If Broken: Exit all long positions immediately, wait for new setup
- Probability of Break: Low (15%) but must be respected
Key Events This Week:
- Tuesday: ISM Services data (economic health indicator)
- Wednesday: Weekly oil inventory report (could cause volatility)
- Friday: Jobs report (affects overall market sentiment)
Warning Signs to Watch:
- Technical: Short-term trend staying bearish for more than 3 days
- Volume: Declining volume on any bounce attempts
- Support: Any trading below $62.50 for extended periods
- Time: No progress toward $66.50 target within 10 total trading days
Positive Signs to Look For:
- Technical: Short-term trend flipping back to bullish (key confirmation)
- Volume: Above-average volume on any recovery moves
- Support: Strong buying interest at $62-63 zone
- Momentum: Clean breakout above $64.50 with follow-through
________________________________________
Forward-Looking Adjustments
Modified Risk Management:
- Position Size: Use 50% of normal position size until both timeframes align bullish
- Stop Loss: Tighter stops at $62.75 (just below support zone)
- Entry Patience: Don't chase - wait for pullback to support levels
- Profit Taking: Be more aggressive taking profits at first target ($66.50)
Revised Entry Strategy:
Before Buying, Confirm ALL Three:
- Price: Trading at or near $62-63 support zone
- Technical: Short-term trend signal flips back to bullish
- Volume: Above-average buying interest visible
Timeline Expectations:
- Days 1-3: Expect pullback/consolidation phase
- Days 4-5: Look for bullish confirmation signals
- Days 6-10: Resume advance toward $66.50 target if signals align
- Beyond Day 10: If no progress, reassess entire strategy
Success Metrics:
- Minimum Goal: Protect capital during pullback phase
- Primary Target: $66.50 within 2 weeks (revised from 1 week)
- Risk Limit: Maximum 2% account loss if support fails
- Time Limit: Exit strategy if no directional progress within 10 days total
Simplified Decision Framework:
Green Light to Buy: Price near $62-63 + Short-term trend bullish + Good volume Yellow Light (Wait): Mixed signals, choppy price action, low volume
Red Light (Exit): Price below $62, bearish trend continuing, time limit exceeded
________________________________________
Bottom Line: The bigger picture remains bullish, but short-term signals suggest a pullback first. Use any weakness to $62-63 as a buying opportunity, but only with proper confirmation. Be patient - the setup is still valid but timing may be delayed by a few days.
________________________________________
Document Classification: Trading Analysis
Next Update: September 6, 2025 (Weekly Review)
Risk Level: Moderate (controlled institutional setup)
This analysis represents continued validation of a systematic, institutional-grade trading methodology with demonstrated predictive accuracy and risk control capabilities. This is a view that represents possible scenarios but ultimate responsibility is with each individual trader.
Risk Disclaimer: Past performance does not guarantee future results. All trading involves risk of loss.
การนำเสนอที่เกี่ยวข้อง
คำจำกัดสิทธิ์ความรับผิดชอบ
ข้อมูลและบทความไม่ได้มีวัตถุประสงค์เพื่อก่อให้เกิดกิจกรรมทางการเงิน, การลงทุน, การซื้อขาย, ข้อเสนอแนะ หรือคำแนะนำประเภทอื่น ๆ ที่ให้หรือรับรองโดย TradingView อ่านเพิ่มเติมที่ ข้อกำหนดการใช้งาน
การนำเสนอที่เกี่ยวข้อง
คำจำกัดสิทธิ์ความรับผิดชอบ
ข้อมูลและบทความไม่ได้มีวัตถุประสงค์เพื่อก่อให้เกิดกิจกรรมทางการเงิน, การลงทุน, การซื้อขาย, ข้อเสนอแนะ หรือคำแนะนำประเภทอื่น ๆ ที่ให้หรือรับรองโดย TradingView อ่านเพิ่มเติมที่ ข้อกำหนดการใช้งาน