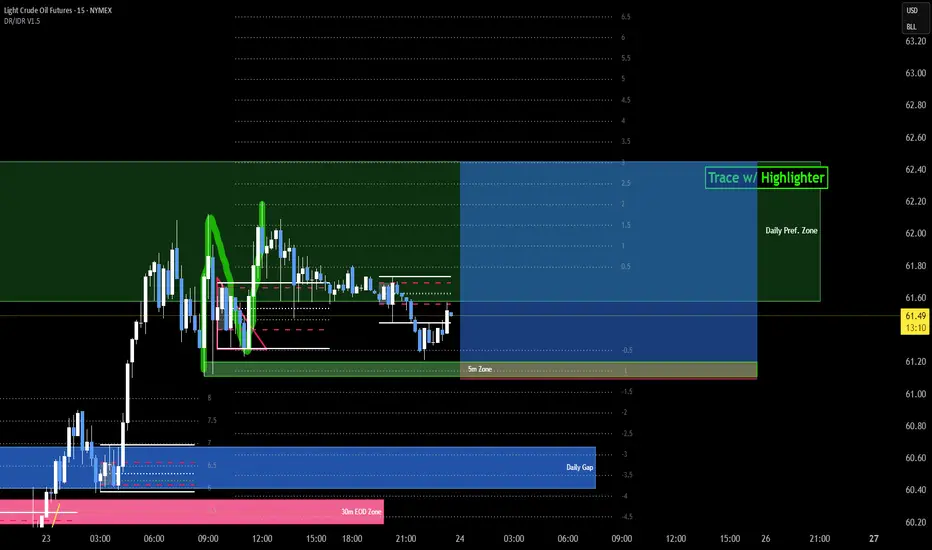
Important to Highlight the price action to show where exactly the new high is (tp), where is the liquidity that should be just above the zone, and the source of the move (the zone using the 5 minute chart).
I look for the last "doji" before the move that closed in the opposite direction.
So, in this idea, the zone is based on the last down doji candle before the up move.
And for longs, I mark the zone starting at the Open of the doji candle and down to the lowest point of that doji wick.
I look for the last "doji" before the move that closed in the opposite direction.
So, in this idea, the zone is based on the last down doji candle before the up move.
And for longs, I mark the zone starting at the Open of the doji candle and down to the lowest point of that doji wick.
คำจำกัดสิทธิ์ความรับผิดชอบ
ข้อมูลและบทความไม่ได้มีวัตถุประสงค์เพื่อก่อให้เกิดกิจกรรมทางการเงิน, การลงทุน, การซื้อขาย, ข้อเสนอแนะ หรือคำแนะนำประเภทอื่น ๆ ที่ให้หรือรับรองโดย TradingView อ่านเพิ่มเติมที่ ข้อกำหนดการใช้งาน
คำจำกัดสิทธิ์ความรับผิดชอบ
ข้อมูลและบทความไม่ได้มีวัตถุประสงค์เพื่อก่อให้เกิดกิจกรรมทางการเงิน, การลงทุน, การซื้อขาย, ข้อเสนอแนะ หรือคำแนะนำประเภทอื่น ๆ ที่ให้หรือรับรองโดย TradingView อ่านเพิ่มเติมที่ ข้อกำหนดการใช้งาน