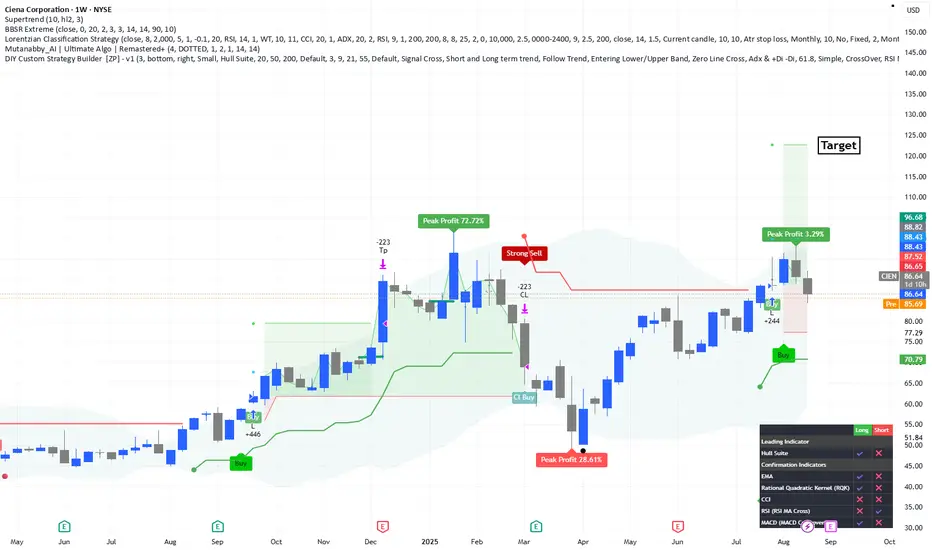
Spotted a promising long setup on Ciena Corporation (CIEN). The weekly chart shows bullish momentum supported by trend indicators and volume.
🔹 Entry Zone current levels
🔹 Stop Loss: $70 – below super trend
🔹 Target 1: $98.84 – first resistance zone
🔹 Target 2: $110.00 – extended target based on historical highs
Technical indicators like Supertrend, RSI, and MACD are aligning for a potential continuation. Risk management remains key – monitor volume and broader market sentiment.
Let me know your thoughts or if you're watching CIEN too!
#CIEN #Ciena #NYSE #TechnicalAnalysis #SwingTrade #TradingSetup #Finance
คำจำกัดสิทธิ์ความรับผิดชอบ
ข้อมูลและบทความไม่ได้มีวัตถุประสงค์เพื่อก่อให้เกิดกิจกรรมทางการเงิน, การลงทุน, การซื้อขาย, ข้อเสนอแนะ หรือคำแนะนำประเภทอื่น ๆ ที่ให้หรือรับรองโดย TradingView อ่านเพิ่มเติมที่ ข้อกำหนดการใช้งาน
คำจำกัดสิทธิ์ความรับผิดชอบ
ข้อมูลและบทความไม่ได้มีวัตถุประสงค์เพื่อก่อให้เกิดกิจกรรมทางการเงิน, การลงทุน, การซื้อขาย, ข้อเสนอแนะ หรือคำแนะนำประเภทอื่น ๆ ที่ให้หรือรับรองโดย TradingView อ่านเพิ่มเติมที่ ข้อกำหนดการใช้งาน
