เพิ่มขึ้น
CGCL (Capri Global Capital Ltd) – Possible Reversal from Support
Short Analysis:
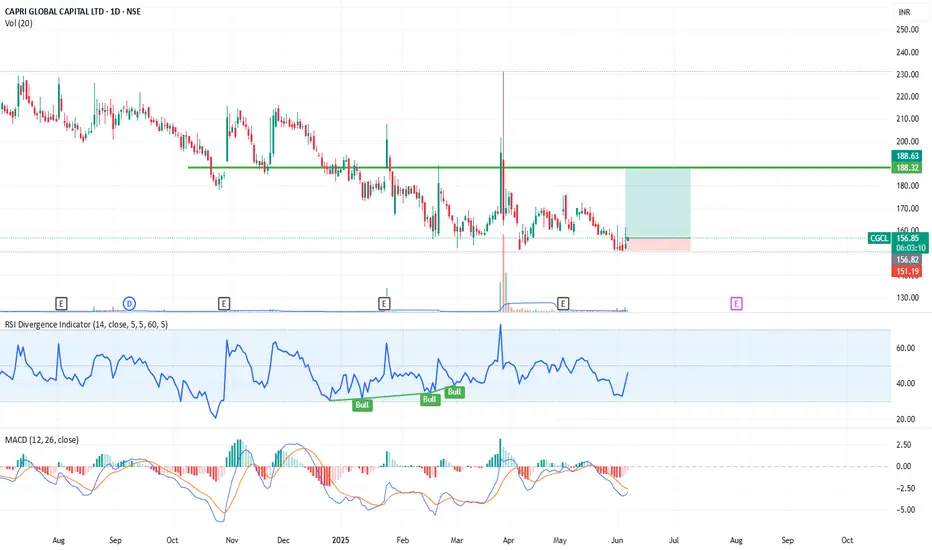
Chart Pattern: The stock is currently trading near a strong horizontal support zone (~₹151–₹155), tested multiple times.
Note: This is not a recommendation, only for study purposes. Do your own analysis and apply proper risk management before making any trading decisions.
Chart Pattern: The stock is currently trading near a strong horizontal support zone (~₹151–₹155), tested multiple times.
- RSI: Shows bullish divergence around 45, indicating potential upward momentum.
- MACD: Close to a bullish crossover, signaling a possible trend reversal.
- Volume: Slight rise in volume supports the current bounce attempt.
- Risk/Reward: Marked risk zone below ₹151.19 and possible target area around ₹188.
Note: This is not a recommendation, only for study purposes. Do your own analysis and apply proper risk management before making any trading decisions.
คำจำกัดสิทธิ์ความรับผิดชอบ
ข้อมูลและบทความไม่ได้มีวัตถุประสงค์เพื่อก่อให้เกิดกิจกรรมทางการเงิน, การลงทุน, การซื้อขาย, ข้อเสนอแนะ หรือคำแนะนำประเภทอื่น ๆ ที่ให้หรือรับรองโดย TradingView อ่านเพิ่มเติมที่ ข้อกำหนดการใช้งาน
คำจำกัดสิทธิ์ความรับผิดชอบ
ข้อมูลและบทความไม่ได้มีวัตถุประสงค์เพื่อก่อให้เกิดกิจกรรมทางการเงิน, การลงทุน, การซื้อขาย, ข้อเสนอแนะ หรือคำแนะนำประเภทอื่น ๆ ที่ให้หรือรับรองโดย TradingView อ่านเพิ่มเติมที่ ข้อกำหนดการใช้งาน