We will examine the price dynamic on this chart. We already know the classic signals: bullish RSI, trading above EMA10/21/50, higher lows, consolidation, etc.
The classic signals are good and valid but this analysis adds another dimension.
The market moves in waves; up and down, up and down.
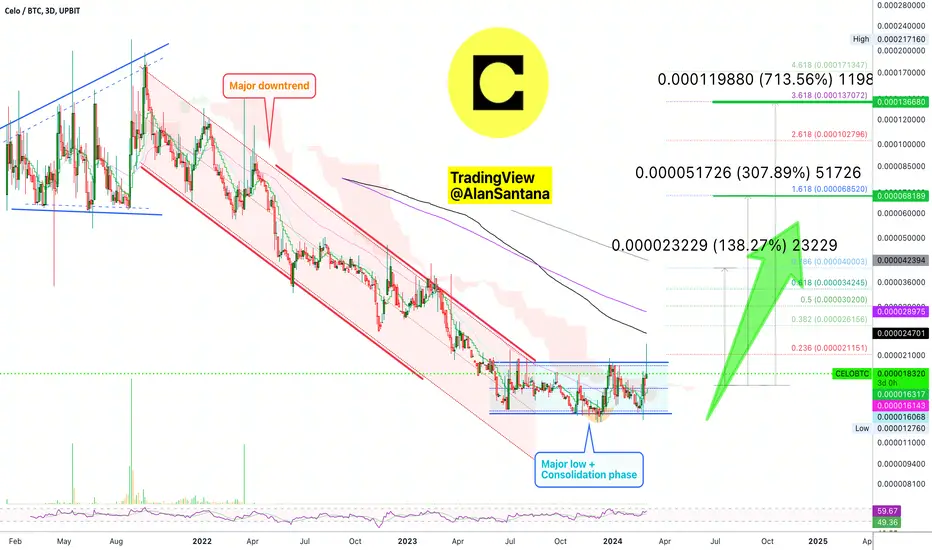
After a period of distribution in 2021, CELOBTC enters a bearish wave (down).
The bearish wave ends with price action going flat (consolidation).
After a bearish wave comes a bullish wave (up).
This "up" wave is what is depicted with a green arrow on the chart.
👉 Very easy, first target is set at 138%; this can happen right away.
👉 Still easy but can take longer, the second target is set at 308%.
👉 Finally, can be much higher just as it can be a bit lower; we can aim for 700% or more to end this bullish phase.
Namaste.
The classic signals are good and valid but this analysis adds another dimension.
The market moves in waves; up and down, up and down.
After a period of distribution in 2021, CELOBTC enters a bearish wave (down).
The bearish wave ends with price action going flat (consolidation).
After a bearish wave comes a bullish wave (up).
This "up" wave is what is depicted with a green arrow on the chart.
👉 Very easy, first target is set at 138%; this can happen right away.
👉 Still easy but can take longer, the second target is set at 308%.
👉 Finally, can be much higher just as it can be a bit lower; we can aim for 700% or more to end this bullish phase.
Namaste.
🚨 LIFETIME (Pay 1, Get 7)
lamatrades.com —Since 2017
🚨 Results
ETH +2150%
CRO +1272%
AAVE +1134%
DOGS +868%
SOL +861%
XRP +749%
BTC +580%
t.me/masteranandatrades/6681
😱 Wow & New Results
t.me/anandatrades/1350
lamatrades.com —Since 2017
🚨 Results
ETH +2150%
CRO +1272%
AAVE +1134%
DOGS +868%
SOL +861%
XRP +749%
BTC +580%
t.me/masteranandatrades/6681
😱 Wow & New Results
t.me/anandatrades/1350
การนำเสนอที่เกี่ยวข้อง
คำจำกัดสิทธิ์ความรับผิดชอบ
ข้อมูลและบทความไม่ได้มีวัตถุประสงค์เพื่อก่อให้เกิดกิจกรรมทางการเงิน, การลงทุน, การซื้อขาย, ข้อเสนอแนะ หรือคำแนะนำประเภทอื่น ๆ ที่ให้หรือรับรองโดย TradingView อ่านเพิ่มเติมที่ ข้อกำหนดการใช้งาน