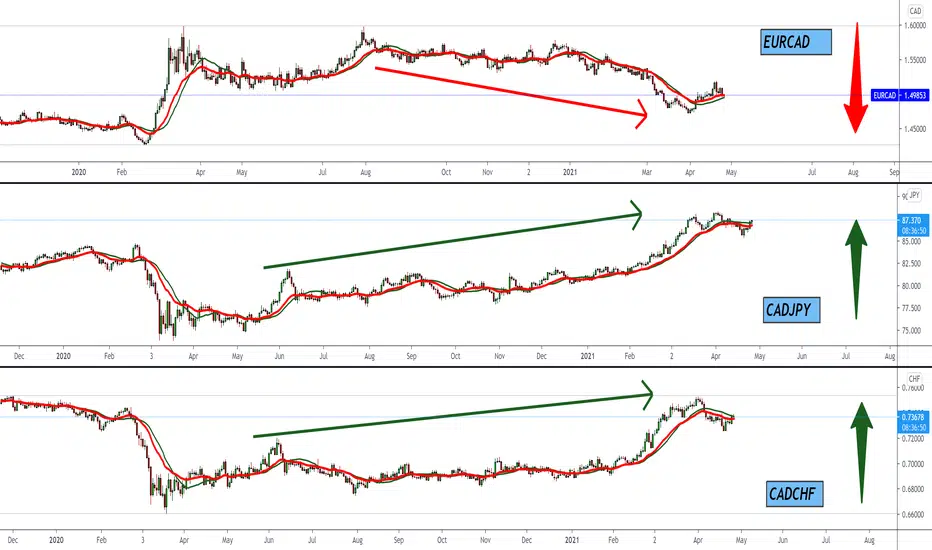
We have three charts to compare:
In the first chart, here we see that the EURCAD is in a bearish trend,
In the second chart, here is a bullish trend, and here we see that CADJPY monitors the movement and mostly coincides with the chart CADCHF, and is totally the opposite of the EURCAD chart,
In the third chart, here we see that CADCHF is totally the opposite of the EURCAD chart, also a bullish trend.
When the EURCAD falls, CADJPY and the CADCHF rises.
This way, you can combine these pairs.
What do you think about that?
Free telegram channel t.me/alexmasterforex
คำจำกัดสิทธิ์ความรับผิดชอบ
ข้อมูลและบทความไม่ได้มีวัตถุประสงค์เพื่อก่อให้เกิดกิจกรรมทางการเงิน, การลงทุน, การซื้อขาย, ข้อเสนอแนะ หรือคำแนะนำประเภทอื่น ๆ ที่ให้หรือรับรองโดย TradingView อ่านเพิ่มเติมใน ข้อกำหนดการใช้งาน
Free telegram channel t.me/alexmasterforex
คำจำกัดสิทธิ์ความรับผิดชอบ
ข้อมูลและบทความไม่ได้มีวัตถุประสงค์เพื่อก่อให้เกิดกิจกรรมทางการเงิน, การลงทุน, การซื้อขาย, ข้อเสนอแนะ หรือคำแนะนำประเภทอื่น ๆ ที่ให้หรือรับรองโดย TradingView อ่านเพิ่มเติมใน ข้อกำหนดการใช้งาน