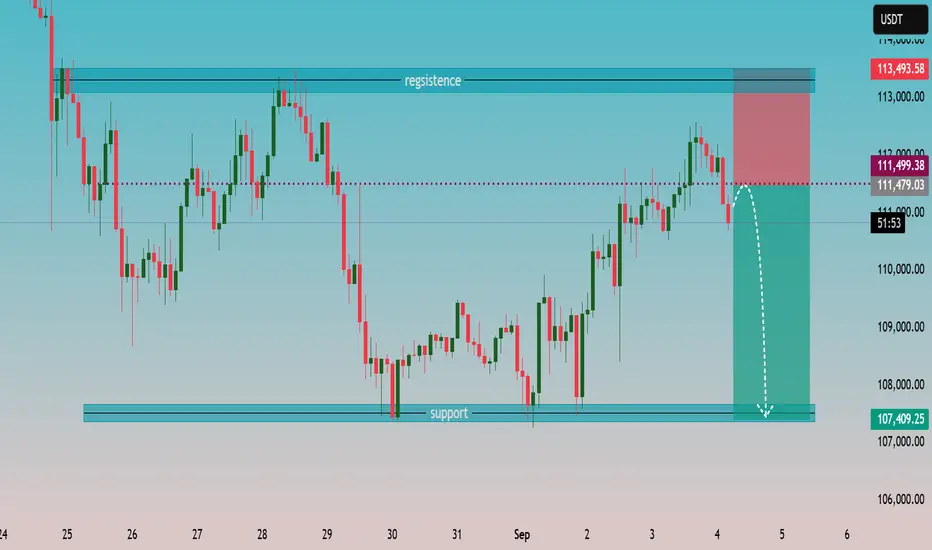
🔹 Resistance Zone (📈💎)
The chart highlights a robust resistance band around 113,000–113,500 USDT. Price has repeatedly failed to sustain above this ceiling, showing strong selling pressure at the top of the range.
🔹 Support Zone (🛡️📉)
Well-defined support sits near 107,000–107,500 USDT, where buyers previously defended the level multiple times, leading to rebounds.
🔹 Current Price Action (⚡🧐)
Recent rally tested resistance and was firmly rejected, forming a bearish engulfing structure on the latest candles.
The dotted red line at 111,499 USDT indicates the short entry trigger; projected target is toward the lower support zone.
Stop-loss marked just above resistance (~113,493 USDT) suggests a clear risk-to-reward framework.
🔹 Bearish Scenario (🚨🐻)
If downward momentum holds, price may follow the plotted white arrow toward the 107k region. A break below could open room for further weakness.
🔹 Bullish Contingency (🚀🐂)
Reclaiming and closing decisively above 113,500 USDT would invalidate the short setup, signaling renewed upward momentum.
📌 Summary (📝)
Market shows rejection at resistance with sellers gaining control. The risk-reward favors a short toward strong support near 107k, unless buyers retake the 113k+ zone.
การซื้อขายยังคงดำเนินอยู่
คำจำกัดสิทธิ์ความรับผิดชอบ
ข้อมูลและบทความไม่ได้มีวัตถุประสงค์เพื่อก่อให้เกิดกิจกรรมทางการเงิน, การลงทุน, การซื้อขาย, ข้อเสนอแนะ หรือคำแนะนำประเภทอื่น ๆ ที่ให้หรือรับรองโดย TradingView อ่านเพิ่มเติมที่ ข้อกำหนดการใช้งาน
คำจำกัดสิทธิ์ความรับผิดชอบ
ข้อมูลและบทความไม่ได้มีวัตถุประสงค์เพื่อก่อให้เกิดกิจกรรมทางการเงิน, การลงทุน, การซื้อขาย, ข้อเสนอแนะ หรือคำแนะนำประเภทอื่น ๆ ที่ให้หรือรับรองโดย TradingView อ่านเพิ่มเติมที่ ข้อกำหนดการใช้งาน