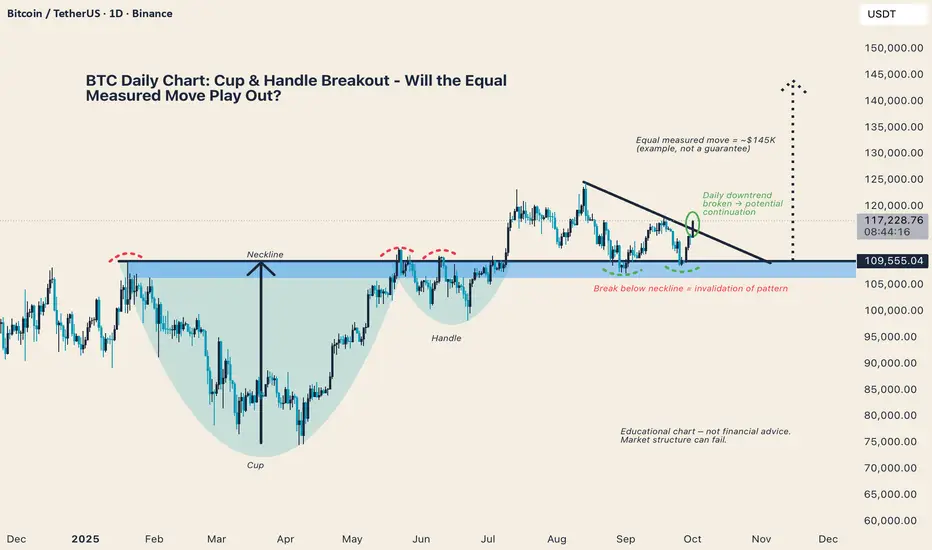
Bitcoin has broken above its daily downtrend while holding above the neckline of a Cup & Handle formation.
Equal Measured Move Example: ~$145K (for educational purposes, not a guarantee)
Key Structure: Sustained closes above the neckline support continuation
Invalidation Level: A decisive break back below the neckline would negate the setup
⚠️ Educational Chart - Market structure can fail. This analysis is for learning purposes only, not financial advice.
What do you think - is this the breakout that pushes BTC into its next leg higher, or will neckline support fail?
คำจำกัดสิทธิ์ความรับผิดชอบ
ข้อมูลและบทความไม่ได้มีวัตถุประสงค์เพื่อก่อให้เกิดกิจกรรมทางการเงิน, การลงทุน, การซื้อขาย, ข้อเสนอแนะ หรือคำแนะนำประเภทอื่น ๆ ที่ให้หรือรับรองโดย TradingView อ่านเพิ่มเติมที่ ข้อกำหนดการใช้งาน
คำจำกัดสิทธิ์ความรับผิดชอบ
ข้อมูลและบทความไม่ได้มีวัตถุประสงค์เพื่อก่อให้เกิดกิจกรรมทางการเงิน, การลงทุน, การซื้อขาย, ข้อเสนอแนะ หรือคำแนะนำประเภทอื่น ๆ ที่ให้หรือรับรองโดย TradingView อ่านเพิ่มเติมที่ ข้อกำหนดการใช้งาน