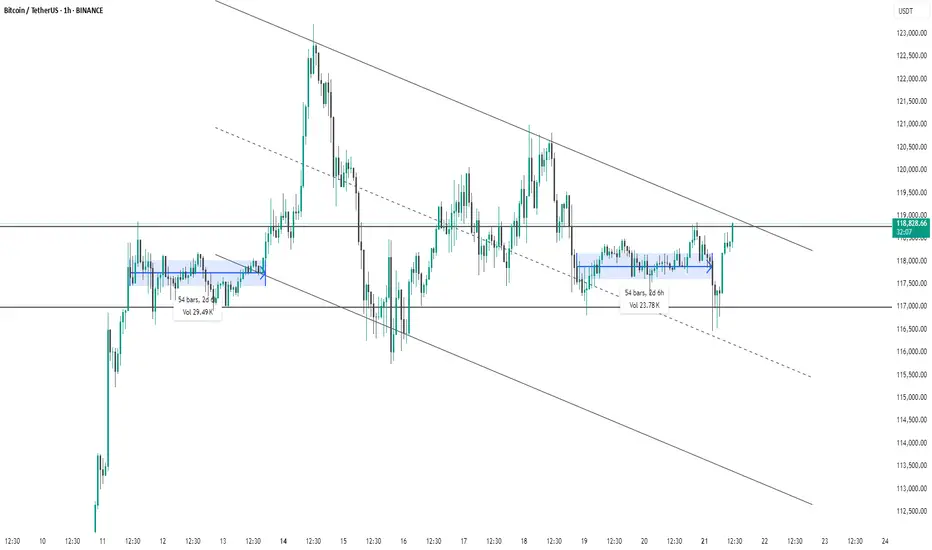
This 1-hour chart of Bitcoin/USDT (Binance) shows a descending channel pattern with clearly defined upper and lower trendlines. Price has recently broken out of a consolidation zone (highlighted in blue) and is now testing the upper boundary of the descending channel near $119,000. The breakout from the recent range (lasting 54 bars / 2d 6h with 23.78K volume) suggests bullish momentum. However, for confirmation of trend reversal, a strong breakout above the channel is needed. Until then, the broader downtrend structure remains intact.
thanking you
thanking you
การนำเสนอที่เกี่ยวข้อง
คำจำกัดสิทธิ์ความรับผิดชอบ
ข้อมูลและบทความไม่ได้มีวัตถุประสงค์เพื่อก่อให้เกิดกิจกรรมทางการเงิน, การลงทุน, การซื้อขาย, ข้อเสนอแนะ หรือคำแนะนำประเภทอื่น ๆ ที่ให้หรือรับรองโดย TradingView อ่านเพิ่มเติมที่ ข้อกำหนดการใช้งาน
การนำเสนอที่เกี่ยวข้อง
คำจำกัดสิทธิ์ความรับผิดชอบ
ข้อมูลและบทความไม่ได้มีวัตถุประสงค์เพื่อก่อให้เกิดกิจกรรมทางการเงิน, การลงทุน, การซื้อขาย, ข้อเสนอแนะ หรือคำแนะนำประเภทอื่น ๆ ที่ให้หรือรับรองโดย TradingView อ่านเพิ่มเติมที่ ข้อกำหนดการใช้งาน