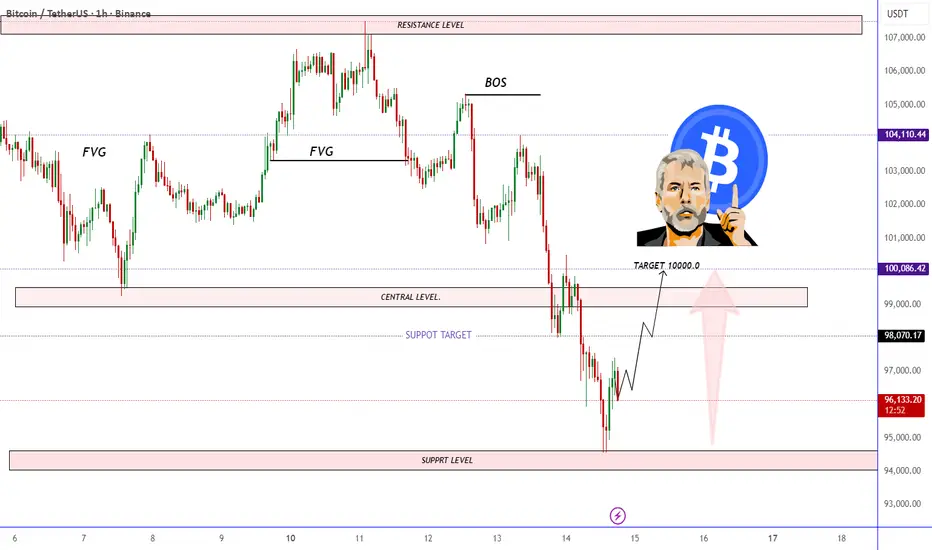
A Bitcoin price chart highlighting key ICT concepts including FVGs, BOS, support and resistance levels. The analysis suggests a potential bullish retracement from the support zone toward the central level, targeting the 100,000 USDT region. The layout shows expected price movement with marked liquidity zones and structural shifts.
การซื้อขายยังคงดำเนินอยู่
ปิดการเทรด: ถึงเป้าหมายการตัดขาดทุน
🎯XAUUSD GOLD BTCUSD Daily 4_5 Free Signals 🚀📊 join Telegram channel
t.me/Gold_blue_pipshunter
✨ Join My WhatsApp Premium Group! ✨ chat.whatsapp.com/EXNJ7pGViJbEKUCDbmTOwG
Join My WhatsApp Premium Group! ✨
t.me/Gold_blue_pipshunter
✨ Join My WhatsApp Premium Group! ✨ chat.whatsapp.com/EXNJ7pGViJbEKUCDbmTOwG
Join My WhatsApp Premium Group! ✨
คำจำกัดสิทธิ์ความรับผิดชอบ
ข้อมูลและบทความไม่ได้มีวัตถุประสงค์เพื่อก่อให้เกิดกิจกรรมทางการเงิน, การลงทุน, การซื้อขาย, ข้อเสนอแนะ หรือคำแนะนำประเภทอื่น ๆ ที่ให้หรือรับรองโดย TradingView อ่านเพิ่มเติมใน ข้อกำหนดการใช้งาน