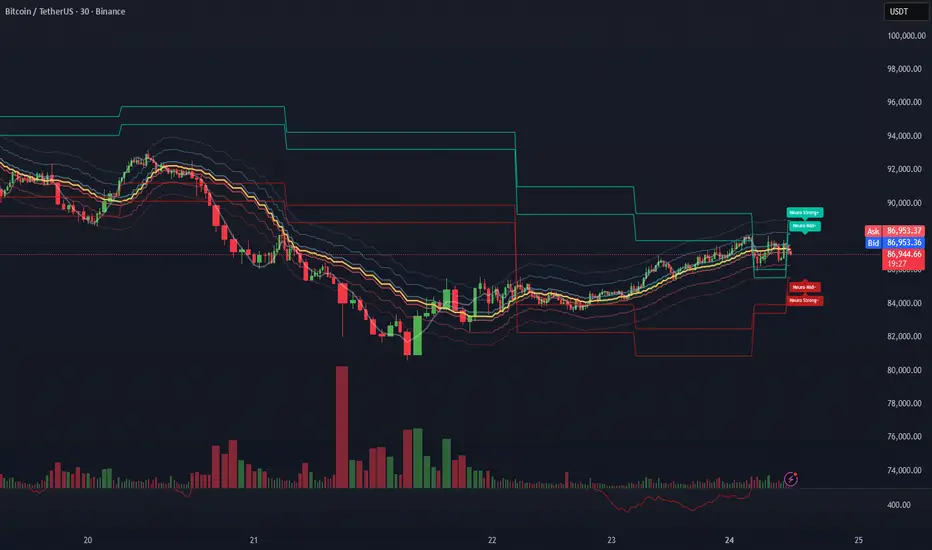
After the sharp selloff, BTC has shifted from a momentum breakdown into a nonlinear stabilization regime inside the NeuroPolynomial Channel (NPC).
Instead of predicting direction, NPC helps quantify where price sits inside its volatility distribution.
1. Current Statistical Position
30m timeframe:
• Trading near NPC Core Cluster
• Distance from lower stress band: ~2.1%
• Distance from upper expansion band: ~1.8%
• Compression factor vs prior leg: ~0.63
This puts price in a statistical mean corridor, not in a trend exhaustion zone.
2. NPC Volatility Zones
Zone Area Distance Role
NPC Strong+ Upper 88,900 – 89,500 +1.8% Over-extension
NPC Upper Band 87,800 – 88,200 +0.8% Continuation band
NPC Core Cluster 86,900 – 87,300 Current Structural equilibrium
NPC Lower Band 85,600 – 86,000 -1.3% Rejection / test
NPC Strong- Lower 84,300 – 84,800 -2.6% Breakdown re-entry
3. Conditional Scenarios (Not Predictions)
Scenario A – Controlled Rebuild (~60%)
If price holds above the core cluster:
→ Rotation zone: 87,800 – 88,200
→ Stretch zone: 88,900 – 89,500
(~+1.8% to +2.3%)
Scenario B – Failed Rebuild (~40%)
If price loses the core cluster:
→ First test: 85,600 – 86,000
→ Risk zone: 84,300 – 84,800
NPC is used here only as a statistical structure lens, not a signal generator.
Let me know if you’re applying this on ETH / SPX / NIFTY — curious how it adapts across markets.
AI-driven market structure analysis.
คำจำกัดสิทธิ์ความรับผิดชอบ
ข้อมูลและบทความไม่ได้มีวัตถุประสงค์เพื่อก่อให้เกิดกิจกรรมทางการเงิน, การลงทุน, การซื้อขาย, ข้อเสนอแนะ หรือคำแนะนำประเภทอื่น ๆ ที่ให้หรือรับรองโดย TradingView อ่านเพิ่มเติมใน ข้อกำหนดการใช้งาน
AI-driven market structure analysis.
คำจำกัดสิทธิ์ความรับผิดชอบ
ข้อมูลและบทความไม่ได้มีวัตถุประสงค์เพื่อก่อให้เกิดกิจกรรมทางการเงิน, การลงทุน, การซื้อขาย, ข้อเสนอแนะ หรือคำแนะนำประเภทอื่น ๆ ที่ให้หรือรับรองโดย TradingView อ่านเพิ่มเติมใน ข้อกำหนดการใช้งาน