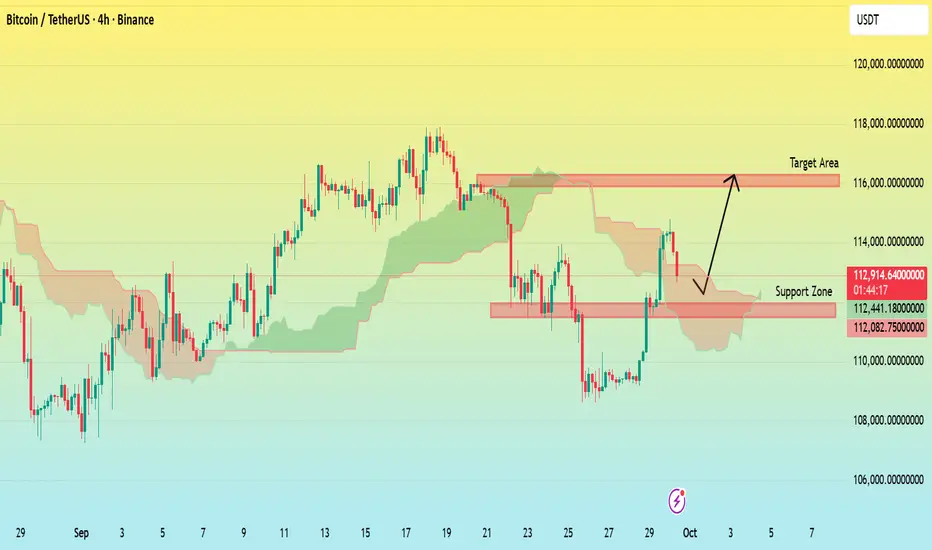
In this chart, Bitcoin is currently trading around the 113,000 USDT level after pulling back from recent highs. The price has respected the highlighted Support Zone, which is acting as a key level for buyers to step in. If momentum holds above this area, the market has the potential to move toward the Target Area near 116,000 USDT. The Ichimoku cloud indicates mixed signals, but as long as support remains intact, a push toward higher levels remains possible.
ปิดการเทรด: ถึงเป้าหมายการทำกำไร
My given target has been completed I will make an other idea soon keep patience and wait . you can see my accuracy in given charts I will make more charts to make your analysis best .Full-time Forex & Gold Trader | Market Analyst | Sharing Setups & Insights | Trade Smart, Trade Secure
t.me/+tac7DeKXDTVhZTU8
daily provide 3-5 free signals with chart analysis
t.me/+tac7DeKXDTVhZTU8
t.me/+tac7DeKXDTVhZTU8
daily provide 3-5 free signals with chart analysis
t.me/+tac7DeKXDTVhZTU8
คำจำกัดสิทธิ์ความรับผิดชอบ
ข้อมูลและบทความไม่ได้มีวัตถุประสงค์เพื่อก่อให้เกิดกิจกรรมทางการเงิน, การลงทุน, การซื้อขาย, ข้อเสนอแนะ หรือคำแนะนำประเภทอื่น ๆ ที่ให้หรือรับรองโดย TradingView อ่านเพิ่มเติมที่ ข้อกำหนดการใช้งาน
Full-time Forex & Gold Trader | Market Analyst | Sharing Setups & Insights | Trade Smart, Trade Secure
t.me/+tac7DeKXDTVhZTU8
daily provide 3-5 free signals with chart analysis
t.me/+tac7DeKXDTVhZTU8
t.me/+tac7DeKXDTVhZTU8
daily provide 3-5 free signals with chart analysis
t.me/+tac7DeKXDTVhZTU8
คำจำกัดสิทธิ์ความรับผิดชอบ
ข้อมูลและบทความไม่ได้มีวัตถุประสงค์เพื่อก่อให้เกิดกิจกรรมทางการเงิน, การลงทุน, การซื้อขาย, ข้อเสนอแนะ หรือคำแนะนำประเภทอื่น ๆ ที่ให้หรือรับรองโดย TradingView อ่านเพิ่มเติมที่ ข้อกำหนดการใช้งาน